Tuesday, February 4, 2014

Currency, VIX and Treasuries Update- Looks Good For Market Bounce

I just double checked the assets that really matter as we seems to just be building a wider , more proportional reversal area, which I'll remind you again was my primary concern last night, that as of last night the parabolic "U" shape that was about halfway done in my estimation, was too narrow and it appears that this is being corrected right now in the market.

However it's the carry trades that are behind really moving the market (USD/JPY) and the other assets that help us confirm our market theory that we have started preparing for would include VIX futures and Treasury Futures (also a move down in long term treasuries opens a trade opportunity for a long position in TLT which would be a long term trend trade).

 USD/JPY 1 min shows the positive divegrence at the overnight lows in which many commentators felt this was a failed overnight market ramp. I already explained that I would not want to see an overnight market ramp to start our move because it would weaken the base/head fake position substantially on such low volume.

What looks like a failed move to them looks like a accumulation opportunity to me as 3C shows.

Intraday I already mentioned a market pullback so divergences can build, since the market is following USD/JPY nearly tick for TICK, this slight weakness in the $USD 1 min chart makes sense and is fine.

 The 5 min chart is much more important to our move, it moves from in line on the move down to positive at this recent range/congestion zone.

Since we can't get very good signals in the FX pairs much beyond 1 min, we look at the individual FX futures that make up the pairs to tell where the currency cross is going.
 The 5 min Yen price and 3C weakness are what we need for the upside move we've been talking about so this chart looks great, it's what we need to make this happen.

Intraday the Yen (1 min) goes from in line on the move down to a slight positive divegrence, again this is what the FX pair needs to do for the market to pullback from today's highs and let it accumulate at the lower end of the price pattern.

The much more serious 15 min Yen chart has a clear and large relative negative divegrence followed by an even stronger leading negative divegrence so I'm really not concerned at ALL with the 1 min chart, in fact it is what is needed at this point for the positive market divergences to grow from here as smart money DOES NOT accumulate in to higher prices.

 The $USD/$USDX is the second part of the USD/JPY pair (if you are long USD/JPY that means you expect the $USD to gain and the Yen to fall). The positive divergences on the 5 min chart are growing.

Intraday 1 min it's pretty much in line, it could fall a bit to help the market pullback or just stay where it is and let the Yen strengthen a bit, it would be the same effect.

The $USDX 15 min chart is showing increased positive divegrences which would help move the USD/JPY up, thus the Index futures, thus the entire market.

However, remember that we are only hitch-hikinh longs on this move we expect, the real trade is selling short in to price strength with underlying market weakness, it's a market gift.

If we look at the same chart zoomed out a bit, it fits out larger scenario perfect (a bounce higher which our trading longs make money, they are sold and then we enter larger, longer term trending shorts before the market rolls over even worse than what we have already seen).

The longer term 15 min chart is significant and while the near term improves and should move to the upside for out trading bounce, the chart on the whole is still very damaged thus it wouldn't take much after a bounce to see strong distribution take hold and get us underway toward our Primary/highest probability trend which is the trending/stage 4 decline or bear market.

 VIX futures are a reach for protection, there's what we see in price and what only we see in underlying strength, at least with 3C, most traders only know what price is doing and that can be very deceptive.

So as the market acts as it did yesterday we'd normally expect to see huge accumulation of protection via VIX futures, but in line with out Trading range last week (accumulation) , move down yesterday below the range (head fake move) and expected momentum blast from the head fake to the upside (bounce), VIX futures underlying trade looks exactly how I'd like to see it, perhaps even better than imagined.

The 1 min intraday chart should move up on a market pullback so this 1 min chart slightly positive is what I'd expect.


 However the deep distribution on the 5 min chart suggests as I said yesterday, there's a rotation moving out of VIX protection at the highs and in to risk assets near the lows or on the cheap, a perfect rotational swap.

This is where the VIX futures exceed my expectations with a 15 min leading negative divegrence. I may just consider a VXX short at this point.

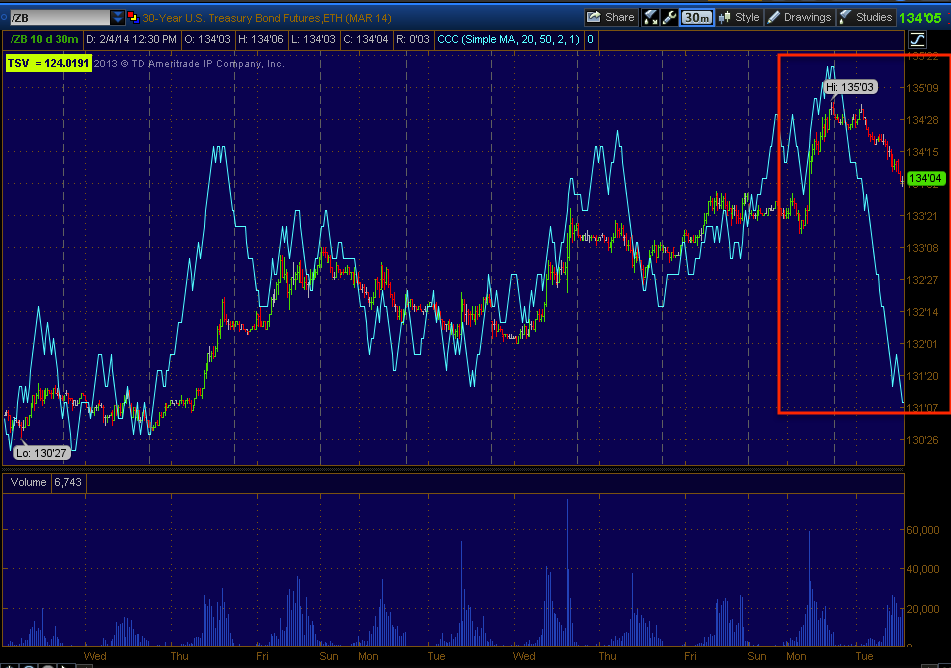
The same concept is true of 30 year Treasury Futures (or the equity version, TLT which is 20+ year Treasuries which I'd like to own as a long term trending trade so a pullback would be very helpful in accomplishing that).
 The 5 min chart of 30 year T futures is leading negative, again suggesting a trade moving out of the flight to safety and in to risk assets (the market long).

1 min intraday for a pullback, we'd expect to see these move up due to their correlation, but a 1 min chart is simply intraday, it's not the larger underlying flow or trend of what's going on beneath the surface of price.

And exceeding my expectations is a 15 min leading negative 30 year Treasury future chart and...

even a 30 min (the longer the timeframe, the more serious the signal).

The equity versions, VXX and TLT are confirming these charts as well. We just need to be patient and let the market finish this formation.

Market Update

I'm still not ready to take on any new positions yet, it's not as much of a concern about whether we launch to the upside as it is timing.

It looks like we'll get an intraday pullback from here, if the market is getting stronger and going to make the move I expect making yesterday's plunge a head fake, then on the intraday pullback we should see intraday 3C charts improve out to the 5 min charts and I think we will.

I was just looking at the TICK charts and they really gave me a strong impression that we'd see an intraday pullback and then the 1 min Index futures that had been in line all this morning going negative (1 min only).

The averages have 1 min negative divergences intraday as well as they have most of the morning, the 2 min charts though are either very strong or have just a slight nit of weakness in their leading position, usually when we get a pullback intraday the 2 min charts go negative as well, but so far most of them, especially the IWM are holding up well.


 Intraday NYSE TICK trends often will give us early warning. Make sure to draw the channels.

My custom TICK Indicator gave early warning yesterday for the upside reversal or improvement, it seemed to be giving some early warning right now as well.

As far as the bottom divergence, take a look at Russell 2000 Futures.
 The 15 min chart is leading positive, this is good, but it won't accumulate and add to that divergence in to higher prices so a pullback intraday would actually do it some good and we can take the temperature of the market and make sure it accumulates lower prices as it should.

 The same with the 5 min chart which were barely positive last night, but heading that direction, this is a mandatory timeframe for a move and so far so good, but again, we won't get a stronger leading positive in to higher prices, they need to come down intraday.

And this is the intraday 1 min chart, it was in line, now it is nbegative so the probabilities of a pullback are very good and that's fine, we'll likely get a better idea of whether we get a wider "U" or a "W" formation.

As far as some assets that I'd like to play on the long side, but think they need pullbacks to build some strength, BIDU I'd like to see move down and have set price alerts to the $150 area.

MCP I don't think needs to do much other than continue to accumulate.

FSLR I have price alerts set for a move to the $47.75 area. I think these will be helpful areas for these assets and allow us to get good positioning and timing.

Movement is what we need to see what's going on so we should get some here.

AAPL Possible Trade Set-Up Price Alerts

I'm still watching AAPL, some of the longer charts are looking pretty good as well as some trends on shorter charts, however it's not quite there yet.

I'd like to see AAPL come down and fill the gap intraday around the $501.50 area and as such, I'm setting some price alerts for that area, that's where I'd prefer to take on a new position (long) in AAPL for a trade, of course I'd like to confirm that shorter intraday charts grow stronger, but I suspect they'd need that pullback to do so.

You may want to set some price alerts if you are considering AAPL long.

Market Update

So far nothing too exciting, we are making that wider bottom which was my main concern last night.

All of the Index futures are in line intraday.

Market Averages (ETF)
 SPY 2 min looks good, this morning's lateral movement is widening the "U" shape, as mentioned above and in last night's Daily Wrap, this was my main concern, that the "U" shape was too tight, even for a parabolic move.

This is the same 2 min chart, I did mention last night that we could end up with a "U" shape in which case we are proceeding fairly well or possibly a wider "W". There is an argument for and against. The argument for a wider "W" is a wider base has more support or gas in the tank for a reversal on the upside. The argument against is that the majority of the accumulation would already be done last week during the lateral range and a head fake move just clears out stops, lures in shorts and primes the market for a reversal (upside move). Either way, we want to see 3C continue to move higher.

 This is the same chart, just showing this morning's lateral movement and how it contributes to a more stable reversal point. Amazingly if you look at enough of these, the preceding trend and the base or reversal process often are proportional. Usually a top is a wider "U" or "n" and the bottom reversals tend to be tighter.

 Ultimately I'd like to see this 5 min chart really take off to the upside more than it has at this point.

QQQ 1 min, as mentioned yesterday the Q's were higher up in last week's range and it took them longer yesterday to move below it which is at the yellow trendline. I didn't expect any positive divergences until we were below the range, it wouldn't make sense, it would be entering too early. The intraday chart seems to just show the slowing down of the intraday divergence to keep a more sideways price flow.


The 3 min QQQ looks good, no deterioration so the 1 min chart still looks like it's just steering intraday price and not much else right now.

 Again as for the 5 min chart, I'd like to see this lead to the upside more. We've seen 15 and 30 min charts lead in a single day so a 5 min chart can do it when it's ready.

 This might be what the QQQ 5 min would look like with either a "W" shape base in which case the second bottom of the "W" would have a very high probability of taking out stops below yesterday's lows before completing or just a wider "U" shape, but as it carries on sideways (whichever form it choses), I'd like to see that 5 min chart make larger leading highs.

This is the 10 min chart and this comes back to the 2 arguments for and against a wider bottom here. The point again is the relative or even leading positive 10 min divergence, this seems to be because of the majority of accumulation was done last week in the flat range, choppy in the range, but lateral (yellow).

IWM 1 min is like the other averages, although not like Index futures which are in line with price.

The 2 min showing a negative divegrence and the reversal process and a positive leading divegrence and a reversal process. When I say process that is because that's what we see 90% of the time opposed to a reversal event which would be a "V" shaped reversal. Institutional money can't move as fast as we can, they can't put together a position with 1 trade, thus the process takes a little time and if you get use to looking at these patterns, you can get a pretty good idea what to expect based on what came before.

Again the IWM 15 min chart has that same leading positive right now which suggests most of the work was done last week as we saw at the time and as was expected before the range developed when we predicted it the preceding Friday.

HYG Update

I'm just browsing around a bit, early trade isn't my favorite for analysis as there are a lot of games being played, but what I do see is the HYG Call position opened yesterday, I could pull about +15% out of that one right now, not bad for less than half a day, but I'm going to hold and this has some bearing on the market because of Credit''s leading nature and especially HYG's as an arbitrage asset.
 Pay attention to the timeframes because I have them a little mixed up for a reason. This is the 2 min timeframe with a clear leading positive divegrence.

Notice how divergences form, this is almost always the case, first a small relative positive divegrence and then a slightly stronger relative positive divegrence (the first two white arrows), as price comes down more and supply opens up, we see a much stronger move toward accumulation with a leading positive divegrence (leading divergences are almost always stronger than relative divergences unless we are looking at a leading divegrence like the last one on this post (timeframe and size).

 This 1 min chart is weaker than the 2 min above, but it does show the most current activity as it responds the fastest so there is a relative negative divegrence on top of yesterday's leading positive. Considering the 2 min chart above and the fact it is a weaker relative negative on top of a leading positive tells me this is most likely a corrective divergence. There are two forms of correction, one is through time like a lateral triangle or rectangle and the other is through price like a pullback. Usually when the divergence is only on the 1 min chart as this one is it's typically a lateral consolidation or through time rather than price, but if the 2 min chart joins the 1 min with a negative divegrence, then the probabilities rise dramatically toward a pullback via price.

 Either way, I'm not too concerned about it as we have a leading 3 min chart as well.

I'm willing to hold HYG for greater upside gains which speaks to the direction of the market as well, especially given the last chart.

This is a 10 min chart, much, much stronger underlying flow of funds. You can see a leading negative divergence to the far left sending price lower and a large relative positive divergence right now, this is what gives me confidence in holding the HYG calls instead of cashing out.

The leading negative divergence on this chart  is stronger than the positive divergence, however although this is really a relative positive divergence because it is relative between two points (the start and end of the arrow), it does have a leading positive quality about it as well.

If we have a leading positive on a 3 min chart and a large relative positive on a 10 min chart , the 10 min chart's signal is going to be the stronger one. One through 3 minute charts are mostly intraday, their trend matters most. At 5 minutes there's a major change and the chart is exponentially stronger, a 10 min chart is even stronger than that. Keep in mind what kind of divergences you have, what timeframes and where they fall on a chart.

Bottom line is, for now I'll hold HYG calls as I think they have more upside soon enough that it's not worth trying to trade around and that has a positive effect on the market.

A.M. Update

I've read in a few places that overnight the USD/JPY tried to stage a rally or "Overnight" ramp and failed. I'm not sure exactly what the USD/JPY was doing, it may have been reacting to an analyst who came out overnight and said the BOJ would buy ETFs if the Nikkei 225 fell under $14000 as early as this month. I have said, "If the USD/JPY breaches the Maginot line of $100, expect the BOJ to step in and try to knock the Yen down".

In any case, if you asked me if I thought an overnight ramp would complete a week long base and head fake move, my answer would have been a resounding no. My main apprehension last night as far as yesterday being a head fake move that will break out to the upside was that the "U" shaped parabolic move of yesterday was a bit too tight and it needed a little more room to widen it our, even for a parabolic move and that would likely come today during regular hours so, No, I would not expect or even want to see an overnight ramp take the market higher, it needs to be done where there's serious accumulation on serious volume, not thin overnight volume.

The Nikkei 225 futures were a big bit of news last night as they lost 400 points, but as of 9:15 this morning they were up 1.80%, while some see rampant and random volatility, I see the same basing / reversal process in the Nikkei 225 futures as the U.S. Index Futures and market. This doesn't mean we are in the clear yet and will get the expected upside move which I expect to be strong, but ultimately a FAIL, we still need to be vigilant and make sure the positive divergences keep building.

This is partly why I said that I think the gap up in the market would be filled as the Russell 2000 and Dow have already done, it's the lateral time that we need, not much, but that's what we need as posted yesterday.
 Nikkei 225 overnight when the doom and gloom crowd came out, -400 points, but give it a minute before judging too quickly. Support was found near $14,000 and as I said, at 9:15 NKD was up +1.80% which is green, something the NKD hasn't seen in a while.

This was also a subject in last night's post, while I think the NKD will bounce too, I think U.S. markets have to lead the move.

Here's a 5 min chart of the NKD, note the clear downtrend and at the yellow arrow a lateral trend, this is not hugely bullish looking at price only, it is however, a change in character and most accumulation is done in to lower or flat prices.

The 5 min NKD 3C chart (see last night's for a wider view, it is leading positive), shows us accumulation on that -400 point drop late last night and a leading positive divegrence in the flat range of the a.m. hours today.

My analysis isn't meant specifically for the Nikkei, it does follow the USD/JPY though and that's ultimately what's going to move the market either way.

This is ES 1 min this morning just before the open, nearly perfectly in line, even with the post I put out saying, "Expect a gap fill", ES has managed to stay in line this morning which is a good start.

 ES 5 min with a couple of neasty negative divegrences, one leading right in to yesterday's plunge, but that doesn't mean yesterday wasn't a head fake move, everything we've seen so far and everything we projected before it happened suggested it would be and is. Right now we have a positive divegrence and lateral movement, this sideways movement would be at the bottom of the "U" shape I showed last night and that's where the price pattern or reversal process needed to be a bot wider as posted in last night's Daily Wrap. This is also why I didn't open more long positions yesterday. 

To be clear, these are long positions that either hedge longer term core shorts or are hitch-hiking trades to make some extra $, they are not a change in attitude or a reflection of my opinion changing to a more bullish one, my opinion is the same, BEARISH, but the reality of the market is it chops around (volatility is especially high just before a major FAIL in the market, it's one of the hallmarks of a market turning from a primary bull to a primary bear trend), there are head fake moves and there are rallies that confuse  market participants, that's what they're suppose to do!

 This is ES 15 min with a positive divegrence at yesterday's lows. When I said we expected a head fake move in my Friday post, "Come Monday", it was a head fake move to the downside, they need to be real, they need to be convincing, just as a bounce to the upside, I wouldn't expect a 1 or 2% move, I'd expect something that will fill my inbox with emails asking, "Are you sure the market is still bearish Brandt, this looks awfully bullish".

 This is the Yen 1 min overnight with a lot of chop, but generally trending lower which is what we need to see for the USD/JPY to make an upside move and take the market with it.

This is the larger 5 min Yen trend which is clearly sitting in a negative divegrence suggesting more downside, again, what we need to establish yesterday as a head fake move and an upside move to follow, that's the point of a head fake move, check out the articles I posted on Friday if you haven't... "Understanding the Head Fake Move".

 Now we have a fairly strong 15 min Yen negative divegrence, this is what I'm looking for on a move like yesterday's in the market to help me verify it's a head fake move. Today's data should seal the deal whether it is or not, but I'm leaning 80% that it is and as such, that opens up some nice positions for quick trades and ultimately opens nice positions for core shorts.

The $USD fell on a negative divegrence causing market weakness, this isn't the legacy correlation with the market, usually it''s the opposite, but this is the Carry correlation and we are still in carry mode.

The recent positive divegrence confirms what we are seeing in the Yen.

This is the $USD/JPY (candlesticks) vs ES (purple), they track each other so USD strength and Yen weakness moves the USD/JPY up and takes the market with it.

This is the USD/JPY (candlesticks) and the Nikkei 225 futures (purple), like we've seen at least 4 times in the last week, the USD/JPY leading the Index tends to see the Index revert to the carry cross.

Gold has been another dent indication of what's going on in the market, I almost opened a GLD put yesterday, I posted it as a trade idea and it would have made money this morning. Gold has been moving opposite the market, look at the correlation this morning.
 Here the 1 min chart of gold futures looks like a little bounce, that would produce a gap fill in the market averages, maybe something a bit more.

Remember, head fake moves are fractal too so we could have one just below yesterday's lows before the "U" shape or perhaps a larger "W" shape head fake move is complete. The real definition of a head fake move can't be understood until the process is complete and you see how it fits in to the bigger picture.

 Gold 5 min is choppy, but largely negative. This is what kept me out of GLD puts yesterday, it wasn't as clean and clear of a signal as I'd prefer. It looked like the market had more lateral chop and that doesn't make for a great directional trade, although it can set a great directional trade up.

This is what I'm really interested in, a 15 min negative in gold futures, when the 1 and 5 min charts are negative like this, that's a clean and clear signal to buy GLD puts and expect a market bounce and a strong one.

I'm not hedging my analysis, you know what I think, my opinion is little changed in more than a week and thus far every bit of it has come true, the timing has been off a few days, but it has come true.

However, if anything changes in the market, I'm not married to my analysis, BUT I WILL LET YOU KNOW AT THE FIRST SIGN OF ANYTHING GOING DIFFERENTLY THAN WHAT I EXPECT.