I just double checked the assets that really matter as we seems to just be building a wider , more proportional reversal area,
which I'll remind you again was my primary concern last night, that as of last night the parabolic "U" shape that was about halfway done in my estimation, was too narrow and it appears that this is being corrected right now in the market.
However it's the carry trades that are behind really moving the market (USD/JPY) and the other assets that help us confirm our market theory that we have started preparing for would include VIX futures and Treasury Futures (also a move down in long term treasuries opens a trade opportunity for a long position in TLT which would be a long term trend trade).
USD/JPY 1 min shows the positive divegrence at the overnight lows in which many commentators felt this was a failed overnight market ramp. I already explained that I would not want to see an overnight market ramp to start our move because it would weaken the base/head fake position substantially on such low volume.
What looks like a failed move to them looks like a accumulation opportunity to me as 3C shows.
Intraday I already mentioned a market pullback so divergences can build, since the market is following USD/JPY nearly tick for TICK, this slight weakness in the $USD 1 min chart makes sense and is fine.
The 5 min chart is much more important to our move, it moves from in line on the move down to positive at this recent range/congestion zone.
Since we can't get very good signals in the FX pairs much beyond 1 min, we look at the individual FX futures that make up the pairs to tell where the currency cross is going.
The 5 min Yen price and 3C weakness are what we need for the upside move we've been talking about so this chart looks great, it's what we need to make this happen.
Intraday the Yen (1 min) goes from in line on the move down to a slight positive divegrence, again this is what the FX pair needs to do for the market to pullback from today's highs and let it accumulate at the lower end of the price pattern.
The much more serious 15 min Yen chart has a clear and large relative negative divegrence followed by an even stronger leading negative divegrence so I'm really not concerned at ALL with the 1 min chart, in fact it is what is needed at this point for the positive market divergences to grow from here as
smart money DOES NOT accumulate in to higher prices.
The $USD/$USDX is the second part of the USD/JPY pair (if you are long USD/JPY that means you expect the $USD to gain and the Yen to fall). The positive divergences on the 5 min chart are growing.
Intraday 1 min it's pretty much in line, it could fall a bit to help the market pullback or just stay where it is and let the Yen strengthen a bit, it would be the same effect.
The $USDX 15 min chart is showing increased positive divegrences which would help move the USD/JPY up, thus the Index futures, thus the entire market.
However, remember that we are only hitch-hikinh longs on this move we expect, the real trade is selling short in to price strength with underlying market weakness, it's a market gift.
If we look at the same chart zoomed out a bit, it fits out larger scenario perfect (a bounce higher which our trading longs make money, they are sold and then we enter larger, longer term trending shorts before the market rolls over even worse than what we have already seen).
The longer term 15 min chart is significant and while the near term improves and should move to the upside for out trading bounce, the chart on the whole is still very damaged thus it wouldn't take much after a bounce to see strong distribution take hold and get us underway toward our Primary/highest probability trend which is the trending/stage 4 decline or bear market.
VIX futures are a reach for protection, there's what we see in price and what only we see in underlying strength, at least with 3C, most traders only know what price is doing and that can be very deceptive.
So as the market acts as it did yesterday we'd normally expect to see huge accumulation of protection via VIX futures, but in line with out Trading range last week (accumulation) , move down yesterday below the range (head fake move) and expected momentum blast from the head fake to the upside (bounce), VIX futures underlying trade looks exactly how I'd like to see it, perhaps even better than imagined.
The 1 min intraday chart should move up on a market pullback so this 1 min chart slightly positive is what I'd expect.
However the deep distribution on the 5 min chart suggests as I said yesterday, there's a rotation moving out of VIX protection at the highs and in to risk assets near the lows or on the cheap, a perfect rotational swap.
This is where the VIX futures exceed my expectations with a 15 min leading negative divegrence. I may just consider a VXX short at this point.
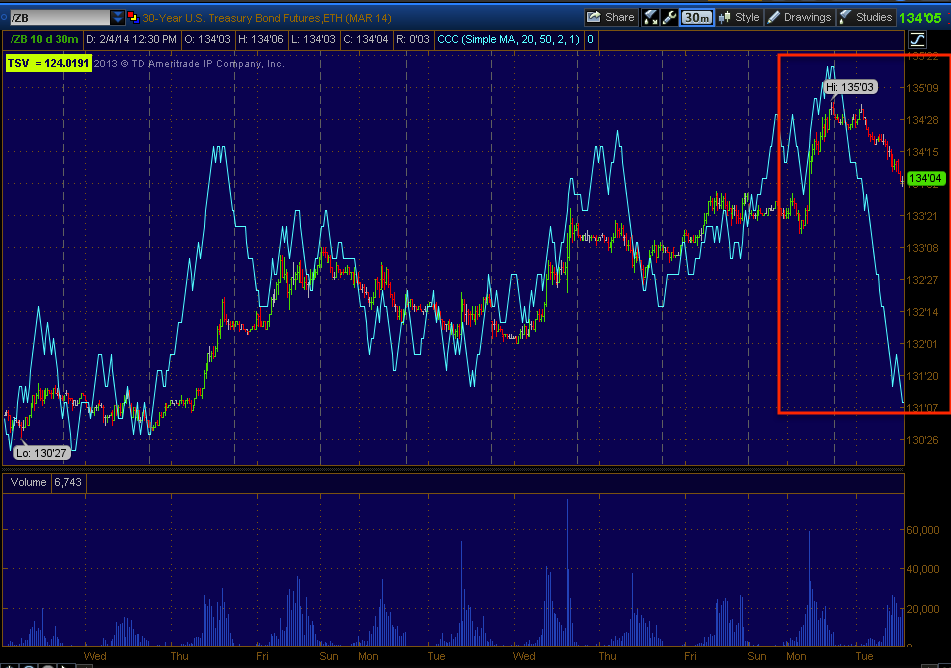
The same concept is true of 30 year Treasury Futures (or the equity version, TLT which is 20+ year Treasuries which I'd like to own as a long term trending trade so a pullback would be very helpful in accomplishing that).
The 5 min chart of 30 year T futures is leading negative, again suggesting a trade moving out of the flight to safety and in to risk assets (the market long).
1 min intraday for a pullback, we'd expect to see these move up due to their correlation, but a 1 min chart is simply intraday, it's not the larger underlying flow or trend of what's going on beneath the surface of price.
And exceeding my expectations is a 15 min leading negative 30 year Treasury future chart and...
even a 30 min (the longer the timeframe, the more serious the signal).
The equity versions, VXX and TLT are confirming these charts as well. We just need to be patient and let the market finish this formation.


No comments:
Post a Comment