Thursday, February 20, 2014

Taking AAPL March $535 Puts off the table

I'll post some charts, this was always meant to be a quick trade. If I'm right about the market then I'd simply re-enter the AAPL puts at a better entry after taking these profits, essentially, "Wash, Rinse and Repeat".


P/L

Carry Trade Update

So far the market is acting in a very normal way, waves.

As far as my suspicions about the USD/JPY, they appear to be on track.

 This is the intraday Yen, earlier the positive divgerence was smaller, it has built out as I suspected earlier today. You'll notice price is forming a rounding (more lateral) bottom as the divegrence continues, this is the one that will send USD/JPY/Index futures lower when it fires to the upside, but to break $102 solidly, it's going to take a decent divergence here.

 The USD's negative divegrence continues to build, it's substantially stronger than it was earlier.

The USD/JPY itself is seeing a continued, larger negative divegrence building, there was almost no positive divegrence around 3 a.m. when it switched directions and lifted Index futures which were moving down in the early hours.

In any case, as far as the rest of my suspicions, we'll have to see, so far I don't see anything jumping off the chart, it looks like a very normal day, however I think we are right on track with the USD/JPY which has reconnected to the Index futures correlation as we saw overnight, there's still at least a 60-70 point disconnect in the correlation.

Scenario

This is a possible scenario I've come up with for today's intraday trade based on the charts we have now. I started considering this based on the USD/JPY overnight action... why save it for now? Here's a scenario...

First let me show you the QQQ, we have been watching this deteriorate and it's in unrecoverable position, but this is what we expected from a head fake move as well so it shouldn't be a surprise.


Obviously intraday charts can change quickly, but this is what I think is a reasonable scenario and I want to let you know because it allows you to consider how you might want to use it to your advantage, I'll tell you at the end how I'd be looking to use it.

First the QQQ
 The 30 min charts I thought might hold up positive are just destroyed as you see, this is the distribution that will move the market lower just like...

This 30 min accumulation moved it higher, of course there was a lot of volatility at the trend pivot, they rarely are a clean break.

This would be a clean break in the QQQ, just looking at it you can see most charts don't look that way, there's more volatility in them, especially at trend pivots.


 As far as all the intraday chart like 1 min they were negative and in line, this is at reversion. From here on an intraday basis, the Q's could make a lateral price move (with the broad market) that allows enough intraday accumulation for a intraday pop higher from here. I think the minutes sealed the fate of this last trend so it's not anything I'm concerned about, but it may be something I can use.

 I'm just showing these other charts so you can see how thorough the damage is... 3 min QQQ

 5 min QQQ

 15 min QQQ and you saw the 30 min at the top.

If the market can put together an intraday base (don't forget about the op-ex pin tomorrow as well), then we could see a psychological game played, even though the minutes destroyed market hopes as they brought up a rate hike way before anyone expected them to, retail follows price, that's all they know and thus this can act as another small trap.

With the SPX so close to resistance, a pop above will change retail's sentiment to bullish as it is a breakout above resistance, many of them will buy it and that creates the trap as you can see above, the destruction in the charts is complete, however intraday, that makes sense especially looking at the QQQ price trend I drew above.

The USD/JPY would play a large role and I think it already is as the approximate 10 point loss in ES overnight was saved by a reversal just before Europe opened to send the FX pair back above $102 and UIndex futures reclaimed the lost ground from overnight.

 USD/JPY 1 min is already negative and we are already seeing some downside volatility, but this divergennce should be bigger to really break the Carry trade, to do that it needs the Yen to develop a bigger positive divegrence and the $USD to develop a bigger negative divegrence, that all is just a matter of time, that's it.

 Yen 1 min positive already is causing trouble in USD/JPY since the open, but this base is just one sharp "V", it needs to broaden out to do real damage to the USD/JPY and the market.

The same concept is true of the $USD, just it needs a larger top/negative divegrence.

While all of this is building, the market is not usually going to just sit in one place so why not hit buy limits just above on the SPX in the mean time, it only helps as a head fake with downside momentum once the USD/JPY is ready to break down.

The way I'd use this is in assets like GLD I mentioned yesterday, I wanted to short them in to strength, if the SPX does what I am proposing, that strength in price in GLD should appear allowing me to enter the position that I refused to chase lower yesterday.

There are plenty of other assets tat the same concept can be applied to.

That's a plausible scenario and a way to use it to your advantage, I'll keep an eye on the way things develop and what assets might make some of the better positions.

Overnight Observations

Good Morning.

The math here is pretty simple; despite a slew off economic reports from Asia to Europe coming in ugly, the market cares about one thing only right now which is not good considering the 60-70 point dislocation, but that would be $102 on the USD/JPY.

Overnight...

 5 min USD/JPY, yellow arrow is the 2 pm release of the minutes, the market didn't take them well as you can see, the red arrow is the 2:30 a.m. reversal of the USD/JPY overnight and the red trend line is $102, the maginot line all week.


 That sent ES down overnight and then recovering following the USD/JPY.

TF looks like this ...

The Index followed USD/JPY a bit better, it still doesn't look good.

NQ looks almost exactly the same.


The 1 min USD/JPY is already seeing a negative building in, the red line is $102, but the Yen and $USD are pretty much what I'm going to be watching for a lot of the day.

Both are VERY early in to a reversal divergence that would send the USD/JPY lower, I'm guessing by the afternoon.

We'll see what else is out there, but as we suspected Tuesday trade is all about the pair and more specifically $102.

Wednesday, February 19, 2014

AAPL Update

AAPL Puts were opened last week I believe, March $535's, as of the 14th of February they were down 29% so I'm sure as of the close yesterday that was quite a bit more if not double, today they have recovered a lot of that and are only down 1%, these options can cover a lot of ground fast and we aren't even in to the move I'm looking for in AAPL yet.

I like to show this at turning points because it gives you an idea of how the majority of retail was positioned, remember this is a broad tracking portfolio, not a trading portfolio which means every options idea I put out there is tracked, it's not the way I'd trade because gains are diluted with so many positions, but it still gives a good idea of a slight change in the market and how that effects rank which tells you a lot about the majority of the crowd (as you know, I like to set up positions ahead of time and short in to strength/buy in to weakness, so when a turn comes our positions are already in place).
For the week the options tracking portfolio is #17 of 609 competing portfolios which puts us in the top 3% and you also know that I don't swing for the fences with options, but rather use them as tools. Obviously the vast majority of the crowd was positioned long/calls in to this week.


Here's what we have...

 This is the daily AAPL chart, this isn't the worst divergence out ther, as I have mentioned several times, I believe AAPL is transitioning in to a MSFT which use to be an even stronger growth stock than AAPL, then they issued a dividend and became a range bound large cap dividend stock, I think AAPL's growth story is over and they'll start to look like a MSFT.

In any case, since AAPL already saw a -45% decline from its highs, I don't think it has as much downside as some others, thus one of the reasons I chose to use some leverage with AAPL Puts rather than an equity short.

I also want to point out the rally in yellow, but look at 3C already in a deep leading negative position. For the most part with a chart like this, we can assume the probabilities of the rally in the yellow box being anything more than what you see there are very low and the probabilities of downside and a lower low are very high as the primary divegrence is already in place.

The concept is akin to a bear market counter trend rally, it can move sharply to the upside, but you know the probabilities are heavily skewed in that rally failing and the primary bear trend resuming, this is what I was trying to say in the last post when I said,  "3C is in line with price, it doesn't need to be negative because it already is".

 This is another example, the 15 min chart which shows the accumulation that fueled the run up (and note there's almost always a proportionality between the size of the base and how far the base can carry the asset before a failure) and now we have a much larger, stronger leading negative divegrence, this tells me that when looking at AAPL now vs AAPL back during that accumulation period,  a lot more shares were sold and sold short recently than were accumulated, of course we wouldn't be able to have a price reversal if that were not true as smart money would still need upside to sell/short in to.

 The 30 min charts that I thought would hold together until the SPX breaks down below the 200-day moving average are all falling apart. Today's distribution alone is significant on this 30 min chart, it's pretty clear to see the leading today.

 As far as migration, where we see divergences first and how they flow, this 5 min chart (as I said in the last post) was already negative so there's no need for "Extra negative", price has a long way to go on the downside just to revert to the 3C signal.

 The 1 min chart shows a negative yesterday morning and today we have in line on the downside move which is what we want to see.

The 2 min chart also negative, has a small intraday positive, stocks rarely move in a straight line so it's likely we'll get another minor wave that rolls up and then rolls down as the larger tide continues to move out.

These kind of signals (if they materialize in to a move) are very useful as tactical entries that give you a better entry with less risk as you already know the more important charts show the probabilities are very bearish.

 the 3 min chart, also very negative yesterday and before and also a small positive forming. For March AAPL puts, this small positive is no threat at all, unless it was much bigger I won't even trade around the options position. If I were to close the put to trade around the positive signal, it's more out of Theta or time decay while we wait for that move to complete than it is about any worry that the expected trend is in trouble.


The 5 min chart again, but a closer look at the positive. You can also judge the size of the negative vs. the positive and since AAPL hasn't moved anywhere near what the negative divegrence implies, you have a pretty good idea that any intraday price strength or bounce from a positive like that is best used as a short entry (sell or short in to strength, not chasing it on the way down).

Quick Update

Right now 3C is in line with the moves lower in the market averages, it doesn't need to be negative because it was already negative, in other words thus far we have confirmation of the move lower which is not a surprise given how bad the divergences already were.


I'm going to try to get to some more assets.

BIDU Core/Trend Short Update

I like to see what some of the popular stocks are doing, BIDU seems to be seeing rapid deterioration, not a good sign for the market.

 I have a BIDU core short position, it's down -2.9% which isn't bad, I'm going to fill this out although I don't think I have much room left for it, whatever there is, it's going to full size.


 The 15 min chart is where the divergences were for BIDU's move, they are turning here as you can see. Longer term charts are already in trouble so this swing type move seems to be wrapping up which means I want to enter my short in the area or fill it out.

The 30 min chart is a good example of the damage in BIDU, the divergences and confirmation on the 15 min chart are different than a 30 min chart, for a positive divegrence to show up on a 30 min chart it has to be significantly bigger than what is on a 15 min chart, they were not that big and I expect it is because this was always intended to be a move just like this, a strong swing trade, but it's like a wave rolling up the beach and getting ready to roll back down while the longer term charts are akin to the tide going out.

 Intraday we've seen a lot of damage, especially since the minutes- 2 min

And that is migrating, that means the divegrence is strengthening since the minutes were released, you can see that in 3C at the far right.

Futures Update

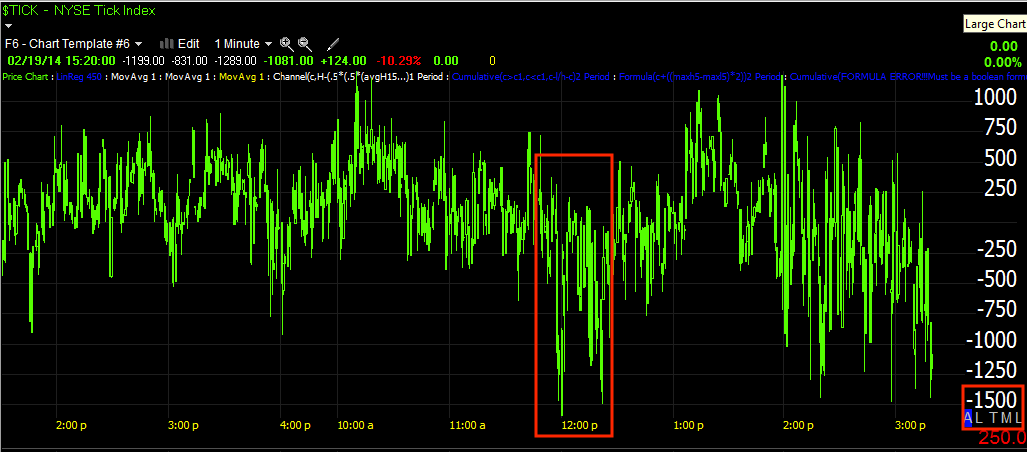
We know the negative divergences are there, the breadth via intraday NYSE TICK is VERY ugly, that said...

I see a lot of what I call "Steering divergences", these aren't meant to accumulate or distribute, they are meant to move price or most often pin price at a certain level, in this case it looks like it has been trying to keep price pinned not too far away from break even, however at the same time the USD/JPY and the Yen and $USD futures are seeing growing divergences which should send the USD/JPY lower, that move hasn't happened yet, but it would likely be a more effective way to move the market to the downside, instead of just letting it float down on retail trade, have all of the algos kick in at once and move the two together... this is the general gut feeling I get.

There could also be an attempt to stabilize the market for a knee jerk reaction, but typically they are right away, thus the name "Knee jerk".

Here's an earlier example of how the market was getting in to trouble around noon time and there were some steering divergences to stem that downside trouble that was building as we had hit a downside negative TICK extreme of more than -1500, note how bad the current TICK trend is as well.

Earlier the market trend was turning down and started to get really serious with  at least 1500 more NYSE stocks moving down than up at the moment, that was stemmed at least until the minutes came out. Now you can see a clear trend in TICK to the far right and it's once again making multiple probes below -1500 which is bearish for the market.


Here are some charts that make things a little more clear, I have a lot more to look at.
 ES with numerous small steering divergences to hold off any get away on the upside or downside.

The same for NASDAQ 100 futures

And for Russell 2000 futures.

Again, a possible reason is that a downside move leaving the longs holding the bag and completing an effective bull trap in which the door is shut hard on them would be to move the market down with the USD/JPY which looks like it's close to making a downside move, just not completely finished with it's set up.

This is the Yen futures overnight, their strength meant USD/JPY and Market Index weakness, pre market there was a small negative divegrence and a move lower allowing the USD/JPY to move up and allowing the market some support from the USD/JPY moving up, however since then, the lows in the Yen intraday have been under accumulation for a move higher (sending the FX cross and Index futures lower).

 The other half of the currency cross / carry trade is the $USD itself, here the $USDX is seeing a negative divegrence which would confirm the signal the Yen is giving and result in the USD/JPY losing ground and perhaps taking out the $102 level which would certainly be felt in the market averages.

This is the USD/JPY itself, you see the early positive divergence I showed several times today, enough to provide the market with some support, without this I don't think the market would look to good right now, but the divergences all seem to point the same way and that is for the next trend to be down and as you know, I suspect the SPX 200 sma as the first stop.

The divergence here is in keeping or confirmation with both the $USD and the Yen.

Gold futures, it made a pretty sharp move lower. At least the DUSt long is open.

GLD

I really want to enter a 2x short GLD ETF/ETN, for liquidity the only one I like is DZZ, a 1x short GLD ETN, because of this for the most part...
 This is a pretty horrible looking near term chart.

In all honesty the overwhelming emotion right now is, "I don't want to miss the trade".

That's an emotional response called greed, I had a plan earlier which was to short in to GLD intraday strength and 3C weakness, to chase GLD down and enter DZZ long here is making an emotional decision in my view rather than an objective one and it creates more risk, sometimes it's better to miss the trade than to chase it.

I considered entering a partial position and entering the rest if we get some intraday GLD strength, but I'll hold off and stick to the plan and if I miss it, there's another bus right around the corner.

I do still have a long DUST position (3x short Gold Miners), that will stay in place.
DUST.

Typically we have more of a knee jerk response, usually it is a response to the headline news, but when you dig down deeper you get the real story and I believe other times it's used to create wiggle room to enter positions, say a knee jerk up in GLD so a GLD short can be entered. I'd like to see that happen, but again I want to make decisions based on objective data and we just got the minutes, it's almost like we need to look at 3C anew (at least for the very short term reaction), strategically nothing should change.

I'll hold off, but I do have price alerts set for a move higher in GLD to short in to via DZZ long.

Initial Thoughts...

As you might know, we not only have a new F_E_D chairwoman, but several new voting members rotating in, on whole they are more hawkish than the member's rotating out.

The F_E_D seems concerned about low inflation, however to my ears on the whole, the talk about RAISING RATES by mid 2014 seems to be way AHEAD of what the bond market was expecting. There was talk about guidance because rates were originally guided to be raised AFTER QE ends and when unemployment hits 6.5%, we are at 6.6% right now so we are very close.

The meeting seems to want to address that guidance, but there was no mention of how they'd do so (as far as I know without reading the minutes).

However the one thing that has really spooked the market even more than tapering is the prospect of rate hikes, I didn't expect talk about possibly hiking rates by mid 2014, I always had the feeling it would be out to 2015, maybe even 2016 so even though this may have just been a handful of member's talking about this, I can't imagine the market is going to take this well, I think they may have expected guidance that told them, "Don't worry about the 6.5% unemployment rate threshold, we are going to keep rates low for an extended period", but that's not what we got, in fact all it seems we got is talk about "Talking about" forward guidance regarding the unemployment threshold and rate hikes.

Remember Yellen already said last week (after the meeting) that QE would continue on pace, so whatever was said in the minutes probably is not that important being Yellen has spoken out in the interim.

My take is net market negative, but often we get a knee jerk before those fears show up in market discounting.

More on the inflation concerns as I get a chance to read the actual minutes.