Thursday, March 27, 2014

Trade Idea Equity Long ETF: FXP

FXP is a non-leveraged China 25 short or simply a way to short China, I've been looking for an opening here all of 2014 and until recently there was no decent one. I think I've put this out 4 or 5 times already so this is a reiteration as I really do like it for a long position for short exposure on China.

If anything substantial changes for the better or worse I'll update it again.

As of now it's still in good buying position in my view as it finishes up the reversal process.

 FXP Daily chart with the first break of the trendline for 2014 on hopes of Chinese stimulus from the PBoC as they continue to drain money out of the system via repos.

 15 min chart and the reversal process, yesterday's entry is similar to where we are today.

The 5 min chart showing today's action in the same area is still on track and overall...

A clean 15 min positive divgerence

Everything is not what it seems

There's been quite a bit made about yesterday's 15,450 SPX put contracts bought yesterday from 11:57 a.m.-1:12 p.m. in chunks for about $200 million in options premium, of course a put is a bearish bet, the amount of stock that controls is roughly $2.9 billion and CNBC has suggested this is what spooked the market, but options are a tricky thing and blatant trades like that are not always what they seem.

I have also received reports this morning that VIX options that have been holding their premium well are seeing double digit declines in their premium this morning for the forward month and May, which is interesting, on one hand a very VISIBLE bearish options play and on the other VIX premiums dropping hard.

I would just caution not to assume too much about the options as there are dozens upon dozens of reasons someone might open a position like that which doesn't jive with what you'd assume they opened it for, it could be a totally different reason than a bearish bet. 

For instance, if you haven't seen it already, listen to what Cramer says in this video (one of the only ones I can watch and one everyone should watch) from the Street.com) about how he would use options to create a lie to create a new reality, in short they were used to give the market an impression that was not actually fact, it was manipulation.

THIS VIDEO is dated, but listen to what he says about AAPL, this was before the first I-Phone launch, you'll see how common this manipulation is.

Otherwise we had a 5th day of pump and dump, a little different theme today as ES futures were run up overnight to be dumped pre-market...
ES pumped overnight and dumped with 3C showing distribution before the dump and this was earlier this morning, on the open we have a knee jerk ramp that has confirmation so far.

30 Year Treasuries were bid as well, a Flight to Safety? The only thing is I see some distribution in them and have since yesterday, not a short in my view as of yet, but with the 30 year up and 5 year down it's forming a bear flattener.

China on their regularly scheduled policy action overnight (Tuesday and Thursday) withdrew more liquidity from the system, in fact almost twice as much as last week at $98 bn CNY vs 48 bn CNY last week using repos, so the Chinese stimulus that the market was all worked up about this week and gave us a pullback in FXP (thankfully) again seems to be a pipe-dream imagined up by the market as the PBoC has been clear in saying, "Don't expect stimulus", however the CREDIT situation is getting worse and worse there which we'll look at later, I'm just glad to be long FXP finally.

Initial Claims beat and pretty well and GDP missed for the final 4th quarter revision for 2013.

I'll have an update for you, but I'm interested in what's going on, it seems the market is being gamed and the pundits are blaming it on non-sense.

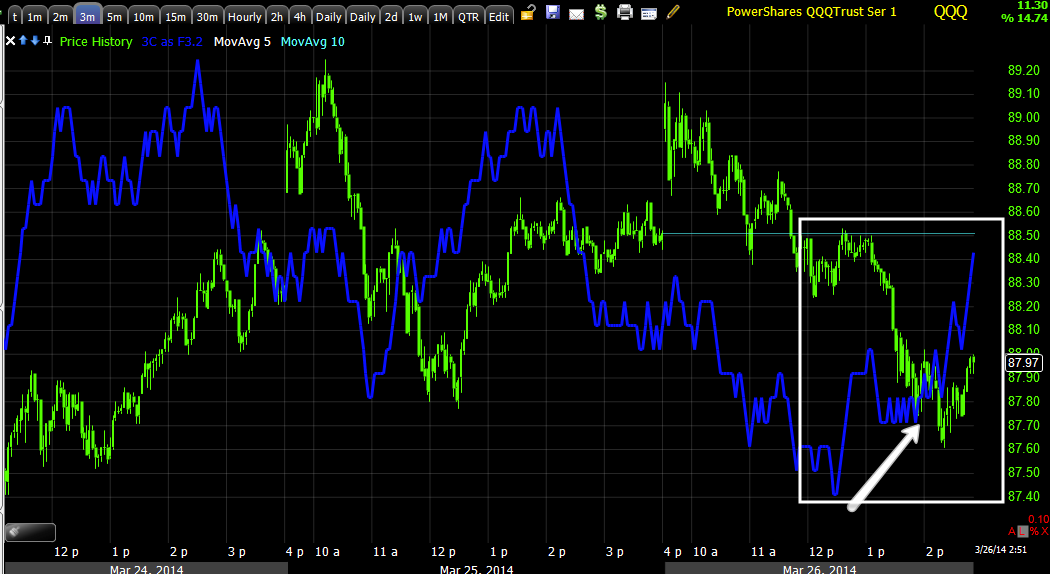
For instance, the Q's which looked horrible yesterday vs the other averages, even before the dump, now look pretty darn good as they held up (underlying trade) during the dump leaving us with a 5 min relative positive and a head fake move in place.
QQQ 5 min relative positive, much larger than before and finally on a respectable timeframe.

Gold and GDX are likely on deck today so get those on your quote screens.

I have some digging to do 

Wednesday, March 26, 2014

FXP- Favorite Position Today

There are a number of positions doing well today, XLF April puts are up nearly 31%, GS April Puts are up +11% and while I considered taking gains on them, the signals weren't screaming to me so I think I'll have to be Jonny on the spot tomorrow morning if we get the opposite of the last 4 days and get a gap down that is faded back up, I'll want to take gains on those fast.

The SRTY position (long equity) was closed today in the trading portfolio to make some room for new positions and because of the momentum there for a 12+% gain.

I saw some things in GLD and UGLD (even though I'm packed there, I thought I'd mention them for you at some point, they had some nice looking charts, but didn't quite get to where I wanted to see them for a new or add-to position, but I think those need to be on the radar. GDX didn't look as good as some of the GLD signals, but I think it will be fine.

Most importantly there was progress in VXX.

As far as my favorite position today, it's FXP which I've been waiting for all year, a way to play China short. We've been tracking it and with the recent talk this week about possible PBoC stimulus which the PBoC already said, "Don't expect any", it seems to have been a perfect opportunity not only for the pullback/entry, but a break of the trendline which triggers stops, creates accumulation of the supply from those stops so the entry there looked to be right on cue.

Here are the charts for FXP which is one of the few actionable assets today, the others will get there, but today wasn't the day, tomorrow morning may be hectic with existing positions like the XLF puts, they may need to be closed quickly right after the open, the rest of the afternoon looked like more stop runs, but I'll update and take a closer look in a bit.

As for FXP, China 25 Short...
 You can see why we had trouble finding an entry in FXP on a pullback this year, but the break of the trendline was a great area, I don't know if we fill the gap and maybe head even lower, even if we do this is still very tradable, we'll see how we look when we are in the area.

The daily candlestick looks good for being right under support of the trendline.

We also have a rounding/reversal process as seen on the 60 min chart for FXP, that means we should have accumulation of the pullback, the kind of pullback we want to buy.

The 60 min shows the negative as the PBoC rumors started floating and the recent positive 60 min in white.

The 15 min is flying and looks great for at least a swing trade.

The 10 min

A beautiful 5 min and as far as timing, the intraday charts looked great.

1 min.

So among a lot of noise today and some rotation out of IWM and toward QQQ which looked horrible as early as today, now looks a lot better, but today, this was the best looking of the positions and I just hope that this can do more than just swing, but hold a trend.


Stops Being Hit

It looks a lot like stops are just being hit in some obvious places.

I was VERY, VERY close to some April 4th QQQ calls, I decided to wait on tomorrow and decide then as it seems stops are still being hit.

However I'd think some interesting positions for short term options (weeklies mostly) will likely open up tomorrow, in the mean time if it isn't screaming, "Buy or short me", then I'm content to just letting the market do it's thing, have it's "seeming " fits and take out the stops, trap some bears, etc.

Again, patience.

VXX making progress

You saw VIX futures earlier and I'll remind you that I have been patiently waiting for 3-4 weeks now to call out a long in VXX, it's just that I know what the signals should look like and part, a big part of why I think there have been some positive divergences in intraday timeframes in the market this week is to pressure VXX down to an area where accumulation can put in the type of divergences I'm looking for.

Today added to timeframes that need it so that's good, but intraday it looks like VXX will come down a bit which is good  for our purposes and the market will likely build a bit from here.

*Remember VXX trades opposite the market.

 The 5 min already looks good, not where it could be, but for any other asset it would be great, it was the 1-3 min charts that needed work.

This 3 min has added to its divegrence today, this is what we need for a meaningful change/pivot to the downside in the market, not for a 1 or 2% correction but for a new leg lower for the year and then some.

Of course smart money isn't going to chase VXX trying to accumulate higher prices lest they drive it up against their position so it needs to come down.

The intraday 1 min above and 2 min below show that process seeming to take hold as the Q's improve, thus we have confirmation.

VXX is not a buy yet, the market isn't where I'd enter a lot of large core shorts yet (for this cycle), but we are now seeing progress.

Closing SRTY (3x short IWM) Trading Position

The Q's are improving, it's as if they needed this downside move to get it together, the IWM is not where I would want it to buy URTY 93x long IWM) or the call position yet, but I'll be glad to take the SRTY gains off the table based on the QQQ improvement alone, ironic that it was the poor QQQ readings that kept me from entering any long positions earlier and now they are the reason I may very well open some as I at least close SRTY for now in the trading tracking portfolio.
SRTY and about a +12% gain in the trading portfolio.


Look at the Q's intraday improve...

QQQ 2 min leading now as 3C held up well vs the price decline.

The troublesome 3 min chart earlier is now looking interesting.

Even out to 5 mins we have a relative positive, that's quite a change in a short period.

As for the IWM...

The 1 min is making some head way, but this likely needs a little more sideways/reversal process and sharper positive divegrences, then it may make for a good call / add to position and / or a URTY long (3x long IWM) or UWM 2x long IWM.

 The 2 min held up pretty well so it seems there wasn't as much distribution as price would suggest which means it was likely an accumulation move on the decline.

Until this 3 min chart is screaming buy, I'm going to hold on doing anything here, just be patient and wait for the probabilities to stack up until it has the kind of divegrences I don't walk away from

MCP Update

Yesterday I mentioned MCP, specifically to a member who was looking at it and said, that's a triangle, you know what it's missing? His reply, "Yeah".

That's part of our concepts of Wall St. using TA against traders, MCP with such an obvious triangle was missing a head fake move, right at the apex of a triangle, it's almost guaranteed and the member knew that without having to think about it, that's what we got today.

Now lets take a look and see if you can spot what is missing before MCP offers a nice long entry...
 This was what MCP's daily chart looked/looks like, the head fake move would almost certainly be there, today's move below the triangle will likely turn out to be a head fake move, but just like earlier today when I didn't enter the IWM calls on the break of $116.19 because I didn't have confirmation yet, we need confirmation no matter how likely if we are really going to have probabilities lined up on out side.

 If you look at MCP's 15 min chart, what's missing now?

If you said a reversal process you are 100% correct, even with a 1-day or half day move down, we still should see a proportional reversal process whether in the form of a "U" or a "W" or a rectangle, etc.

 The 1 min intraday chart shows us what looks to be a loss of downside momentum or one coming as some light accumulation starts, this is likely the start of a reversal process, it's not where you buy even though you have the probable head fake move in, we need to confirm it even though there's an exceptionally high probability it is a head fake move, timing matters as well.


The 5 min chart has a relative positive divergence, that would be a start too, so watch for price to start losing downside momentum and moving sideways, that's where we'll find the confirmation we need and perhaps get in to MCP at the right moment with a better entry and lower risk since the break of support, it can also set a bear trap that gives us lots of upside momentum when it's ready on a short squeeze, keep MCP on the radar, it did what we would want to see it do, now lets see if it finishes.

Index Futures going positive intraday

I may look at opening that IWM call sooner than later.

Trade Idea: Adding FXP (Long)

We waited for FXP to pullback (China 25 short), it has. I'm seeing decent signals as it has broken its uptrend line and it's looking good for a long (equity) entry, options are pretty thin.

I'm going to put this in the trading portfolio although I'm pretty close to being full there.

And That's Why We Always Need Confirmation

The IWM target was hit earlier for a possible add-to call position, I didn't because of the Q chart I didn't like and because I wasn't seeing strong signals of accumulation on the stop run, since we have moved lower.

However right now there's some swelling volume on some candlesticks that are looking similar to hammers, as if they found support in some areas and the volume looks similar to a mini capitulation event at least on an intraday basis.

The market did follow HYG lower as well so it is still in play with some algos.

In any case, the point of the post is, if we do in fact have a mini capitulation (selling climax) intraday, this would be where intraday 3C signals would start to improve. If that's the case, then I may again be looking at adding some call positions or leveraged longs, but only on confirmation.