Thursday, October 2, 2014

Market Update / Leading Indicators

I'm usually not a big fan of early indications before 10:30-11 a.m. in the market just because of the game playing that doesn't have much to do with anything, however this morning it seems since the open, the markets have not been happy with what Draghi said during the press conference as well as the policy decision to leave everything where it's at, I'd think Germany might be a bit more enthusiastic.

Still there are some interesting occurrences thus far this morning. As always the short term intraday charts move so fast that they are often showing something a bit different by the time I capture, notate, upload and post them so lets start with Leading Indicators that are a bit less finicky and I'll capture and place the current 3C charts right at the end,. just before I post this.

First the TICK intraday shows the general tone...


 Intraday NYSE TICK downtrend since the open, apparently disappointment that Draghi isn't going to antagonize Germany any further by going to an illegal (against the EU/ECB charter), all out QE, buying of sovereign debt. However I'd think any serious players in the market know this is not likely to happen as the lawsuits would tangle any program up, the EU/ECB would have to change and ratify a new charter, this isn't an easy process for the ECB to engage in sovereign QE like the F_E_D did, that's why they chose private ABS purchases.

Still, the market was not impressed by Draghi's press conference (when it is, it's usually short lived) as you can see by the TICK trend above which hit a negative -1550 at the lows this morning.

 The Custom TICK Indicator shows the trend so there's some real selling going on like yesterday, the question is, are the buyers on the other side accumulating or just playing hot potato?

 These are my two newest Leading Indicators, the SPX/RUT Ratio and the VIX Inversion, both have been very accurate thus far, although we haven't had a VIX Inversion buy signal since early August, but past signals have been spot on.

The SPX/RUT ratio on the other hand has been very useful. Above it would not confirm new or lower lows and that gave the market a lateral reprieve until the indicator started diverging negatively, sending the market lower and since yesterday it again is not confirming new lows or rather lower lows in the market and starting right where I suspected we might see something happen, at the first day of the new quarter (yesterday).


 This is the SPX (green) vs VXX, which one is unlike the others? Note the underperformance in VXX/Short term VIX Futures.

If I invert the SPX's price, you can see what the normal correlation would be (moving together) and the VXX recent underperformance.

The same is true of spot VIX...
 Here spot VIX actually out-performed to the far left and under-performed to the right .

 Again if I invert SPX prices (as these two usually move mirror opposite each other), you can see the out and under-performance.

HYG has failed to make a lower low with the SPX and is looking like its offering some short term support, the last several times it has done this, the market has taken advantage of it with pops to the upside to varying degrees, depending on how much HYG was leading by.

And as pointed out last night, HY Credit, which was slammed last quarter, especially in the CCC and lower rated, is also posting a positive divegrence.

Now for the 3C charts... Based on everything taken together, I'm not concerned right now about the TQQQ and URTY 1/2 size (3x long QQQ and IWM) long positions added late yesterday, in fact the reason I left them at half size was to confirm a stronger divergence and then possibly add or to be able to move out with very little damage done should I see something worrisome. Make no mistake though, these are TRADES only.

 The 1 min SPY isn't showing much at all, which says something as it's not leading negative and it's not even confirming on the downside,

The 5 min chart is still in good shape, but SPY was not my favorite of the averages for relative performance in a bounce. The most important thing I'm watching for with the SPY right now is the 5 min chart which needs to lock in a pivot in 3C one way or the other so it will either remain in decent shape in which case I know there's not heavy distribution in to this morning's decline or something changes and I maybe have to take some action.

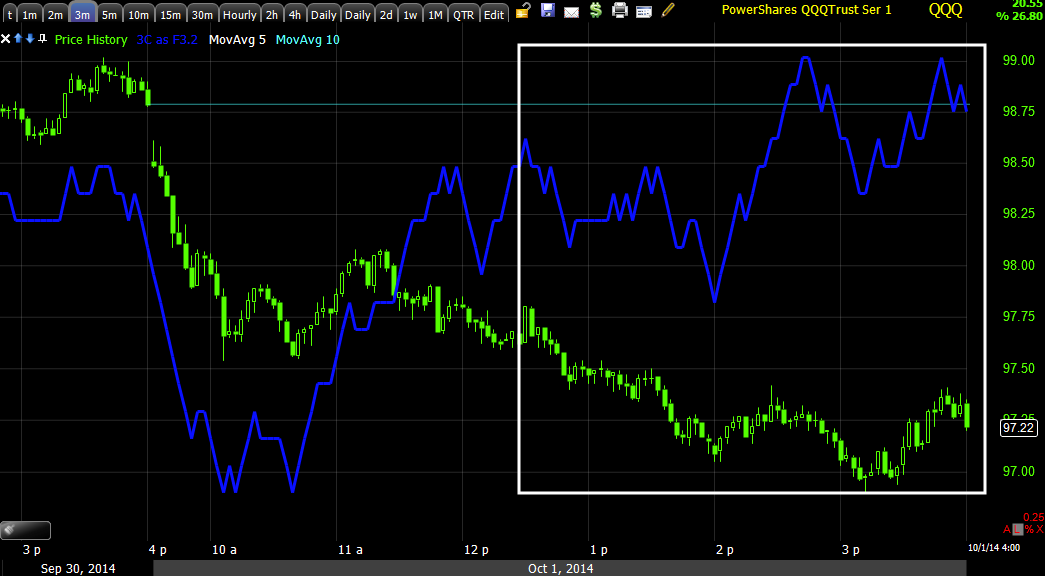
 The Q's only confirmed for a short period this morning and then effectively remained in a leading positive position, it's not the kind of divegrence seen late yesterday, but again, it's not following price lower and taken with Leading indicators above, I'd say that's a net plus for a near term bounce and for lower prices to be accumulated.

 The 2 and 3 min charts could easily be damaged in serious distribution, but remember, smart money usually distributes in to higher prices, they typically accumulate in to lower prices.

The IWM 1 min is in line with price.

However again on the next timeframe, the 2 min which could be in a near vertical drop under heavy distribution, is still in leading positive position.

My take is that there's some light accumulation going on, but I suspect they are waiting for a low that hasn't been made yet to step in with size, they have the full depth of the order book so they'd know where those shares/stops are.

Keep an eye on the intraday NYSE TICK and watch for a break above this morning's channel.


Quick Index Futures

I often say that I won't consider a long position unless the 5 min Index futures have a positive divegrence, everything happened so quickly yesterday afternoon that I hadn't even checked the Index Future 3C charts at the time. Here's what they look like...

The 5 min charts are there... However more so in /NQ (NASDAQ 100 Futures), which is where the change late yesterday was made, QQQ and IWM.
 NQ 5 min divergence.

I was surprised to see divergences already out to the 15 min chart in Index futures...
 ES 15 min with yesterday's late day divegrence showing up as leading.

What I find interesting, although I don't know the exact cut-off time for end of quarter reporting, I would assume it's 4 p.m. EDT on the last day of the quarter. So what I find interesting is the positive divegrence forming and taking shape just after the close on Tuesday with Tuesday being the end of the quarter. This isn't a huge divergence (to the left), but interesting that it seems to pick up right after the close.

The divergence is always at the end of the arrow, the beginning of the arrow to the left is the point of "Relative measurement".

 In NASDAQ Futures on a 15 min chart you can see the same thing. At the time of this divergence, it would have looked so small I don't think I'd even have felt it worthy of pointing out, however adding yesterday's late afternoon divergence, it becomes a bit more interesting although I don't think it has any real effect or meaning for us, it's just an interesting observation about quarter end /window dressing activities.

 And TF/Russell 2000 15 min.

Interestingly there's a small 30 min positive in ES as well, which I probably would not have pointed out if not for the 15 min divergences.

In any case, the 5 min minimum that I look for is there and then some.

A.M. Update

The overnight session has certainly diverged quite a bit with Japan's Nikkei plunging by -2.61% and the USD/JPY falling as low as $108.31 on Yen strength. Regarding the latter, Japan's Finance Minister has said that "No further increases will be tolerated" in the USD/JPY.

The ECB meeting left rates unchanged as tensions between the central bank and the biggest player in the European Union, Germany are on the rise over the ECB's ABS program and just what quality or junk the ECB is willing to accept in ABS purchases, the ECB wanting junk like Greek ABS while Germany demanding that the central bank doesn't become the "Bad Bank", with European banks transferring their junk ABS to the ECB.

Maybe most surprising although I shouldn't be being I decided to open some leveraged longs for a short bounce I expect, is the fact the US futures are near unchanged overnight, the same can't be said of Brent and WTI crude, both sliding with WTI under $90 for the first time in 17 months and Brent at June 2012 levels.

Today we'll be on the lookout for continued divergences, if today sees continued base building, then I'd expect a bounce in to next week, however if we start seeing upside today, I will probably switch back to the short side before the weekend, we;ll find out in just about an hour...

Wednesday, October 1, 2014

Daily Wrap

What can be said about the market that it didn't say itself today? Remember those days earlier in the year in which the SPX was making all time new highs on gains of a 1/10th of a percent (+0.10%)? I was trying to express back then that in a normal market, that would be noise, not something to celebrate or be afraid of if you were short, it was a sign of the market's weakness. Some are saying today's move was because of Goldman questioning US Growth today, however as I have been trying to illustrate with pictures, charts and everything else, the market is like a pier with rotten pilings that may look fine on the top side, but as soon as some pressure , like waves crashing in to the pier, are applied, this is what you get and it can all be traced back to market breadth which can be traded back to 3C distribution divergences.

That said, it wouldn't surprise me if this move below key technical indicators that traders watch as if they were the only thing that mattered, may have its roots in the potential post Window Dressing bounce theory that couldn't begin until...Today.

Today the market is really showing you a sign of its weakness with the SPX down 1.32%, the NDX down -1.60%, the Russell 2000 at an official 10% correction and down -1.48% with the Dow almost neutral on the year with today's -1.40%, which puts it only up +1.34% on the YEAR! As we know the Russell is already down more than 5% on the year.

And Dow theory confirmation, the Transports were down -2.51% on the day, the biggest 1-day drop for them in 8 months. It looks like our timing on that entry was near perfect, but we haven't seen anything yet. This is EXACTLY why patience pays and letting the trade come to you gives you significant advantage.

I said I thought we needed to come down to the lower end of this week's range if any accumulation was going to occur for a bounce, but today's move was 1000% better as it created huge supply that could be absorbed on the cheap. Although I did switch some positions around at the end of the day, it's not because I've changed my thinking on the market, not even close. I do think it's likely that we'll have some more time for the market to put in some stronger signals before any potential bounce, however my half size positions are well covered by the gains they already brought in so I have some wiggle room, but if the 3C charts don't continue to show positive divergences as they did today, I'll be out of those positions faster than I got in them.


All of the major averages  (except the R2K which has already broken all), broke significant moving averages that traders would pay attention to and take action on. As I was suggesting, this creates huge supply at cheap levels, very easy to accumulate and no one  ever asks "Who's on the other-side of the trade?", as if their shares just disappeared in to thin air. Watch the volume around the time of the break of those 50 and 100-day moving averages. If the market bounces from this area, all you'll hear about is the support of the averages, but you'll know why it really bounced, it won't be because of some magical moving average or smart money finding value at those averages and deciding to get bullish.


The post-Window Dressing bounce theme from last Friday's week ahead post is still on the table.

While stocks were selling off, the safe haven treasuries were rallying. In fact, the 10 year's yield closed at 2.403% (interestingly as a sign of  the European economy, for the first time ever Germany issued new 10 year paper at a <1 i="" yield="">which is interesting because it illustrates the flight to safety today in to treasuries with the 10-year's move being the biggest 1-day decline (yields) in 13 months.

I did see some evidence of some distribution in to the 10 and 30 year Treasury futures today, which may be indicative of some rotation toward equities for a bounce and it happened end of day, the same time I noticed some stronger 3C market signals and weaker inverse ETF signals.

For instance..
30 year Treasury futures intraday first in line with the Flight to Safety Trade and then afternoon distribution, both the 10 and 30 year Treasury futures did this. While TLT wasn't quite as sharp and didn't go past 2 min charts, it also showed the same negative intraday signals in to the afternoon, but by and large, since our 8/28 call for a constructive pullback (meaning we expect TLT to go higher after a pb), TLT has done pretty much everything we've forecasted right down to 1-day pullbacks.

Some interesting quarter end data was out today as well. The quarter saw a huge plunge in High Yield Junk Bonds, the biggest quarterly loss since 2011 -1.7% and yields at 1 year highs. Because of the F_E_D's ZIRP Interest rate policies, the "reach for Yield extended to CCC and worse rated bonds being hit the hardest as people were willing to take on virtually any risk for yield as they believed the "F_E_D had their back", but there's a more ominous effect.... These cheap garbage bonds/credit saw new issuance fall to the lowest in 22 months, WHAT DO YOU THINK COMPANIES HAVE BEEN CONDUCTING STOCK-BUY-BACKS WITH? DEBT!

We already know the buyback party ended the previous quarter, but this just nails the coffin so the only marginal buyer of stocks left, corporate buybacks are effectively out of here which has additional market ramifications as we approach the end of POMO later this month.

Also of some interest today was how the system performed with a bit of pressure on it, the CBOE Futures like VIX shut down at 3:42 this afternoon (EDT), we've seen several other , actually quite a few market cracks, declarations of self-help and the such, meaning, once the real nasty stuff hits the tape, you have to wonder how robust the market actually is and the panic it will create when traders can't get out of losing positions due to a broken exchange, just the latest example today for those trying to buy (or sell) VIX Futures on the CBOE (or any other futures).

I caught another mainstream financial media source talking about market breadth today, they were focussed on the NYSE New Lows at 14 month highs,  I really wonder how ignorant the vast majority is to what's really going on under the hood or the pier as it might be?

Speaking of which, breadth declined today as you'd expect. On an intraday basis, TICK and my custom TICK indicator show some interesting things...
 NYSE TICK Intraday was hitting some -1500 readings today, several a bit worse, but note the end of day trend break to the upside, that's around the same time I noted divergences changing rapidly and TICK hit some positive +1000, even close to +1250 readings.

The custom indicator shows TICK hitting a new low for the month today, almost like a capitulation event and then ...

TICK increased to the upside in to the close.

However, the breadth damage is done. Among other things, the New High/New Low Ratio hit lows not seen since 4 years ago.

The NASDAQ Composite's Advance/Decline line is almost unreal when you look at the NDX still where it is, it won't be for long...
 NASDAQ Composite (red) vs its Advance/Decline line (green) hitting new lows for the year...

 The Percentage of NYSE Stocks Trading ABOVE Their 40-Day Moving Average hit a new low for the year at a mere 17.88%!!! This is not only a new low for the year, but all the way back to November of 2012!

The Percentage of NYSE Stocks Trading ABOVE Their 200-Day Moving Average also made a new low for the year with only 40% of NYSE Stocks above their 200-day!

As for the McClellan Summation Index used by trend traders, that's about the most negative short sell signal I've ever seen it give.

As for our daily tracking, the Dominant Price/Volume Relationship was Dominant in Everything but the Russell 2000 which had co dominance of Close Down and Volume Up and Close Down and Volume Down.

All of the other averages had a dominant relationship of Close Down/Volume Up, 21 of the Dow 30, 73 of the NASDAQ 100 and 307 of the S&P-500. This relationship represents a short term oversold or mini-capitulation event and most often the market closes higher the next day.

Taken with the other indications, it's probably not too far off from such a bounce (either this week or in to next week-obviously depending on ongoing divergences).  The 9 S&P groups had 1 close green, the Flight to Safety Utilities at a +.57% gain with Materials lagging at a -2.36% loss.

Looking at the history, we see a major negative shift...
On a 1 day basis 1 of 9 were green, on a 5 day basis, 1 of 9 were green, on a 10-day basis (2 trading weeks) 9 of 9 were red and on a 21 day basis, almost a full trading month, 9 of 9 are red.

As for the Morningstar Industry/Sub-Industry groups, only 12 of 238 closed green today. On a 5-day basis that's 15 of 238, on a 10-day basis 10 of 238 and on a 21-day basis, 16 of 238 closed green.

As for Leading Indicators, HYG was pretty much in line with the SPX which is better than a stick in the eye looking for a bounce.

 My SPX/RUT Ratio Indicator failed to make a lower low this afternoon with the SPX, not a huge signal, but interesting considering the timing and other events this afternoon.

Pro Sentiment is leading which is very interesting, not just one, but...

two as we use two to confirm, this is usually a pretty accurate indication of short term trade as a leading indicator.


And interestingly, High Yield Credit is also giving a short term leading positive signal.

Well that's what I have for you tonight, the divergences end of day that were enough for me to close some core shorts and open some smaller leveraged long IWM/QQQ, breadth significantly oversold as well as the next day Price/Volume Relationship along with the S&P and Morningstar sectors with several leading indicators leading positive.

It's up to 3C at this point to confirm, if I see that, I'll likely bring the short term long positions up to full size before returning back to a full short positioning other than a few small longs like MCP.

It's starting to get exciting and even better, profitable.

Have a great night!

TQQQ (3x QQQ long) & URTY (3x IWM long) Follow Up

I wish I could have gotten the Position Management & Trade IDea : QQQ/IWM post out sooner, but the pros come out at the end of the day and sometimes move indicators in the last 10 or 15 minutes. I needed to decide if this was a big enough move to not only temporarily close two of our best performing shorts (SRTY for sure one of the best performers out there), but also whether it was better to leave the proceeds in cash or to take a position and it wasn't an east decision, the signals are not as obvious after the fact.

I ended up deciding to close SRTY (temporarily) and SQQQ and rather than book the gains and stay in cash, to enter the reverse ETFs, TQQQ (3x long QQQ) and URTY (3x long IWM), but to do so in half size positions.

Given the risk reward profiles of both new positions and given the gains in the two closed positions, I can easily justify half size positions considering what SRTY alone has brought in.

If there are additional signals of more strengthening, I have room to add up to another 50% to bring these up to full size position which is what I'd like to see, but make no mistake about it, I'll be back in SQQQ and SRTY long likely within a week or less, they are where the long term trend is.

As for the IWM and QQQ in the decision making process, they weren't as helpful as you might suspect.

IWM

 IWM 1 min intraday is showing a divergence, this is certainly not the kind of divergence that would have caused me to take the action I took, although it is interesting and developing.

 IWM 2 min has a leading positive divegrence, again, a nice migration from the 1 min chart, but not action worthy, especially not for selling SRTY.

Although this chart may look more bullish in to the end of the day, that was not obvious in the signal until at least 3:45 and then needed to be confirmed in multiple timeframes and multiple assets.
 The 3 min chart is HARDLY inspiring enough to do anything whatsoever, so this had to be taken in to consideration.

And the 5 min chart, while positive and a clean divergence, it's not JUMPING off the chart, I'd normally say, "Give it a few more hours or a day". There's not much of anything beyond the 5 min chart.

QQQ
 The 1 min QQQ shows increased accumulation in to the EOD, again though, this was not apparent until at least after 3:30 and then still it's only a 1 min chart.

The 2 min chart is leading positive, but again, the extent was not visible until well after 3:30 today, around the time the pros come out in force.

 The 3 min chart, like the IWM 5 min is clean, but it is still a 3min chart, not exactly what I'd wager a successful swing trade on.

And the 5 min chart inspires nothing at all...

As for the IWM itself and the August cycle, not only has it entered stage 4 decline, but is well through the start of the cycle at stage 1 accumulation, so again the concept of staging, "Knowing where you are to know where you are going" worked perfectly with HYG leading the market.

As for the 3x long ETFs bought (50% of full size positions), TQQQ and URTY (3x long QQQ and 3x long IWM respectively), they didn't quite solve the puzzle either.

TQQQ
The TQQQ 1 min chart went from a steady positive divegrence to a sharply leading one, however, once again this was late in the day before becoming obvious enough to warrant some attention.

 As you can see, the TQQQ 5 min chart is not nearly enough on its own to inspire the confidence to take on a position here, although I had other reasons, this is one reason I held off at a 50% size position for now.

URTY
 The URTY 5 min chart wouldn't cause you to buy anything.

While the 2 min chart did show some progress, on its own, it's not enough to buy anything.

This is what grabbed my attention as the leveraged ETFs are usually the first to show a signals and the most defined signal, I suppose because of their leverage. Remember the point I demonstrated yesterday, the shorts in place are strong hand shorts, not easily run out of positions.

SQQQ
 The 1 min leading negative divegrence in SQQ grew quite extreme at the end of the day.

This had migration to the 2 min chart leading negative as well and at the time the pros trade the market. There were some other signs, but SRTY grabbed my attention...

SRTY
 The 1 min chart has a steady negative divegrence, on this timeframe it looks like short term profit taking.

 On the 2 min chart it looks a bit more serious than just profit taking.

And on the 5 min chart, it was more than convincing as it led to a new leading negative low and most of that occurred in the last hour of the day.

All in all, I think it was a good decision, maybe a little quicker on the draw than normal, but we had expectations coming in to today which included the kind of price action and accumulation seen.

However, just as a reminder, I will be back in SRTY and SQQQ very soon...
 SRTY 30 min positive and still in line confirming more upside in the days/weeks ahead.

And SQQQ 60 min with an enormous leading positive divegrence/base . These are ultimately where the money is at, but in the near term, I think we can turn over some gains and compound and still be back where we need to be in time to use those extra gains for larger positions