Tuesday, November 18, 2014

Understanding the Head Fake Move: How Technical Analysis Went From an Asset to a Trap

I write nearly every day about a head fake move, a possible head fake move, a probable head fake move, how common head fake moves are before a reversal, etc. In fact I write about it so often, I almost get sick of typing the words and often wonder if you too feel like, "Oh, here comes the head-fake".

However, this isn't a theoretical phenomena, it isn't something that I "think" is happening, in fact it has nothing to do with me at all beyond the fact that I have observed so many that I know them pretty well.

First I want to tell you why I know what I do about head fake moves, a sort of history of their development, it will help you understand them more and help you learn to identify them, know when they are likely and use them to your advantage.

I have been in the market for about 14 years now, however my personality type is when I become engaged or interested in something, I really go overboard to learn as much as I can about it. I first started with Fundamental Analysis after reading several books, I quickly found that it didn't work for me, my opinion is it barely works at all for several reasons: 1) the market isn't about fair price, it's about perceptions, fair value has nothing to do with it. 2) To come to valid conclusions using Fundamental Analysis, you have to have accurate data to analyze the stock, how many times have we seen data that is clearly misleading or down right untruthful ( Global Crossing, Enron, Lehamn, MF Global, etc-these aren't small companies, they were giants and they spread untruthful fundamental data). 3) You have to believe you have an edge in analyzing the data, in fact you have to be better than the analytical departments of some of the biggest banks in the world with hundreds of millions of dollars invested in those department, the best minds with the best information and programs. Do you really think you can outsmart them analyzing a stock after you get home from work?  4) As mentioned above, the market has nothing to do with fair value anymore and fundamental analysis is about determining fair value and looking for stocks that are either below or above fair value to either buy or trade short, but look at the Tech revolution, look at the P/E multiples of companies that weren't even around a year-over 300! Look at the home-builders, were they really worth the prices they were fetching? Again, it's about perceptions, not value. There are many other cases to be made against fundamental analysis, but those are enough to convince me it's not useful.

After a string of horrible trades using Fundamental Analysis, I turned to Technical Analysis. At the time T.A was considered,  "Voodoo Analysis";  people made fun of Technical Analysis, saying things like, "Oh yeah, price crossing a line is a real metric of value" or "All of those lines you follow, do you also watch the lunar cycle or the Zodiac to tell you what to buy or sell?"

I remember this clearly, but I also remember it made a lot of sense to me, the idea was to figure out what the big boys were doing and then follow them and do the same, that is where Technical Analysis has it's roots.

THE SHIFT TO TECHNICAL ANALYSIS...

Almost overnight there were more Technical Analysis books than you could shake a stick at, something changed in the perception of Technical Analysis nearly overnight, at least it seems that way looking back. What was this shift? The Internet.

As soon as the Internet revolution became mainstream all kinds of things changed, low cost online brokers popped up and you could now make a trade for $7.00 instead of $80 that you use to pay to a typical broker. More and more people decided to start managing their own money, especially after a bear market in which their mutual funds declined in a huge way and they sold them right at the bottom for massive losses.

The problem for all of these new-would be traders and portfolio managers was that they didn't have any idea how to decide what to buy or sell, they had jobs, they didn't have a lot of time to research a stock so Technical Analysis with some of the more simplistic concepts such as moving average crossovers as buy/sell signals became a very attractive answer to the problem and the books pushing these ideas cherry picked examples to make it look infallible. MOST WHO TURNED TO TECHNICAL ANALYSIS DID SO OUT OF PURE LAZINESS!

CEMENTING TECHNICAL ANALYSIS AS A LEGITIMATE WAY TO MAKE MONEY

With all of these new books popping up, each with some new indicator or trading system, it became very important for these authors to prove their system worked, that Technical Analysis worked, so if you read enough of these books or went to enough weekend seminars, you were slowly, but steadily indoctrinated with the idea that if an indicator or trading approach did NOT work in a trade, it was because YOU did not use it correctly, YOU did not show sufficient discipline to the principles of Technical Analysis; this would later have huge repercussions.

Technical Traders were brainwashed in to believing they must follow Technical Analysis almost like a cult and if their trade failed it was because their discipline toward the concepts of Technical Analysis faltered so what you ended up with was a group of traders who all did the same thing, all saw the market the same way and none questioned Technical Analysis, in fact to this day even as Technical Analysis is used against traders EVERY SINGLE DAY, they STILL haven't changed, learned or modified their techniques, they just search for a better indicator, the newest and latest "Holy Grail of Trading" and it just doesn't exist! What may work for one stock in one type of market for one type of trader may be a total failure with another stock or in another market atmosphere.

However, this all cemented the legitimacy of Technical Analysis in place as well as the idea that if T.A didn't work for you, it was something you did rather than a flaw in the concept or a changing environment.

Watching Technical Analysis Lose It's Value

I must say, for a while, the VIX below 20 or above 35-40 was a useful reversal signal. Price patterns worked, it seemed Technical Analysis could deliver what it promised, but slowly trade after trade would go wrong, things didn't work out or look the same way they did in the textbooks. Soon it became difficult to feel a high degree of confidence in Technical Analysis, your favorite price patterns that worked so many times before were now less reliable and some of your favorite indicators became less reliable. Some spoke out and did studies and showed how Technical Analysis was either a 50/50 proposition or that it was very effective 20 years earlier, but had lost its edge over recent years. After devoting so much time to understanding Technical Analysis, using it, promoting it, it was difficult to look at these critiques and take them seriously. After all, if Technical Analysis was losing it's effectiveness and Fundamental Analysis was nearly useless, what in fact was left? Out of that dim view, it became easy and almost essential to dismiss any critiques of the effectiveness of T.A.

*I don't mean to say that Technical Analysis is useless, there are still many elements that work especially over a long time horizon, but there's not doubt that it was no where near as useful as it use to be.

YOU CAN'T ARGUE WITH YOUR OWN LYING EYES...

I taught Technical Analysis for nearly 4 years at our county school system's adult education program, it was one of the most popular classes of some 60 or 70 classes and we almost always had to turn people away for lack of a big enough classroom. People were starving for a way to manage their own money, to find out what they were doing wrong, why the concepts in the books weren't working for them. It became harder and harder to justify and sing the praises of T.A. so instead I started showing students ways they could use conventional indicators and techniques in unconventional ways, to effectively "See what the crowd was missing", to modify or modulate the ideas.

However after years of trading exclusively for a living and even more years do nothing but watching the market all day, every day, something became clear to me. There was a repetitive pattern that occurred over and over again, it was Technical Analysis in the short term (the area where institutional money could afford to manipulate the market)  that these failings were most obvious.

After some thought about the history I had lived through with Technical Analysis, the markets and the perception towards Technical Analysis I had noticed, mainly that it was nearly infallible unless your faith or discipline failed you, that it became obvious to me. I realized I could write a book and justify any technical concept I wanted, there are so many stocks, so many time frames and so much history that I could justify any view I wanted with all of this information and all of these scenarios, if I was predisposed in to believing in that view, but was that objective or subjective? The tricky thing about the market is it will give you enough ambiguous information that you can make and back up any view point you want if you look at the information that supports your view and disregard the rest as being some sort of anomaly.  

If an assessment of Technical Analysis was subjective, what was the purpose? You're hopefully in the market to make money, not to justify a way of doing things that you have grown to know intimately, a technique in which you have spent years trying to perfect,  but perhaps is no longer as effective; so it took a very objective view that was oriented to succeeding in the market. It took the willingness to say, "Everything I've learned up until now-thousands of hours of study, MAY NOT BE AS EFFECTIVE AS IT ONCE WAS" and then to ask the question, "What is my purpose in the market, to try to keep doing things the way I had always known and understood like the back of my hand or to maybe step in to a new world that challenges all of my prior views and one in which there is no road map?" The answer to these questions really comes back to that basic market maxim, "Do you want to make money or do you want to be right?"; sometimes the two are VERY different things.

HOW TECHNICAL ANALYSIS BECAME A GIFT TO WALL STREET

By the year 2000 with so many discount online brokers and charting software, the Broker-based Wall Street business model that had been alive for decades was suddenly fading away in to obscurity. College graduates weren't going for their series 7  and other licenses to become a broker, who were people who knew little more about the market than any of us, but had a license to sell (or buy) and collect monster commissions from you, discount brokers too that away.

It didn't take Wall Street very long to understand mainstream Technical Analysis, after all, the big money on Wall Street had been using the most advanced forms of Technical Analysis for decades on monster computing systems that none of us could afford or fit into our home office. It didn't take Wall Street long to realize that when presented with a specific price pattern or indicator signal, that all traders would react the same way. Because Technical Analysis in its attempts to stay relevant to sell more books and seminars had conditioned traders to believe that if the technique failed it was because they didn't stick to the technique, it was the trader's fault for not showing enough faith in Technical Analysis. In a strange way, the proponents of Technical Analysis made the way traders looked at charts so uniform, so predictable that it became very easy for Wall Street to now use those views against these traders.

What was once a system for finding the footprints of smart money in the sand and following them had now been totally turned against Technical traders and their belief and convictions in the validity of T.A. just made it and still make it that much easier for Wall Street to use Technical Analysis against Technical Traders...

In the next section we will look at examples of how Technical Analysis is used against traders, how to spot it, how to validate it and how to use it to your advantage.

BIDU Example

This is a very early thesis as I may discover some new information as I go through closing leading indicators, breadth indicators which are compiled after the close, etc., but this is my first thought or thesis. You saw how fast the GLD divergence was, thus the half size speculative position.

BIDU happens to be one of the assets that I have been watching and am interested in as well as keeping tabs on it for many members also interested in it.

Take a look at the charts, the first charts are more of a macro look and why I'm interested in a BIDU short.

 Daily and especially multi-day charts are indicative of large positions built over time, institutional money on a large scale. If you look at BIDU's 3 day 3C chart, most of it is in line meaning 3C moves with price and confirms the trend, however like 90% of the stocks out there, BIDU was accumulated at the March 2009 lows, in nearly 3 years this is the first divergence strong enough to show up on a 3-day chart, so it is very large institutional accumulation. 

While you can pick out some other divergences on this chart and while there may have been numerous divergences on shorter timeframes, one of the next significant divergences is at the 2013 pivot lows, a large rounding bottom.

After that, the last very noticeable and by far the largest divergence on the chart is a leading negative divegrence in to 2014 and current highs.

This represents large institutional underlying action.

For more color on why institutional money creates divergences this large and how they differ from us in orders, how orders are placed, filled, etc and tactics, I'm going to repost the two articles linked on the member's site, "Understanding the Head Fake Move" as not only is the head fake move in play and important right now, but as I mentioned, it gives some color on a different outlook from an institutional position. I'll post those two articles after this, but they are always linked at the top right of the members' site.

 A daily chart is an exceptionally strong chart, I first saw Home Builders accumulated before, during and after the Tech Bubble implosion and bear market, there was about a year and a half of accumulation at the lows of a tight range and then a couple of years later, (smart money isn't called smart for nothing), those home builders were up 2500% as the housing boom took the tech boom's place.

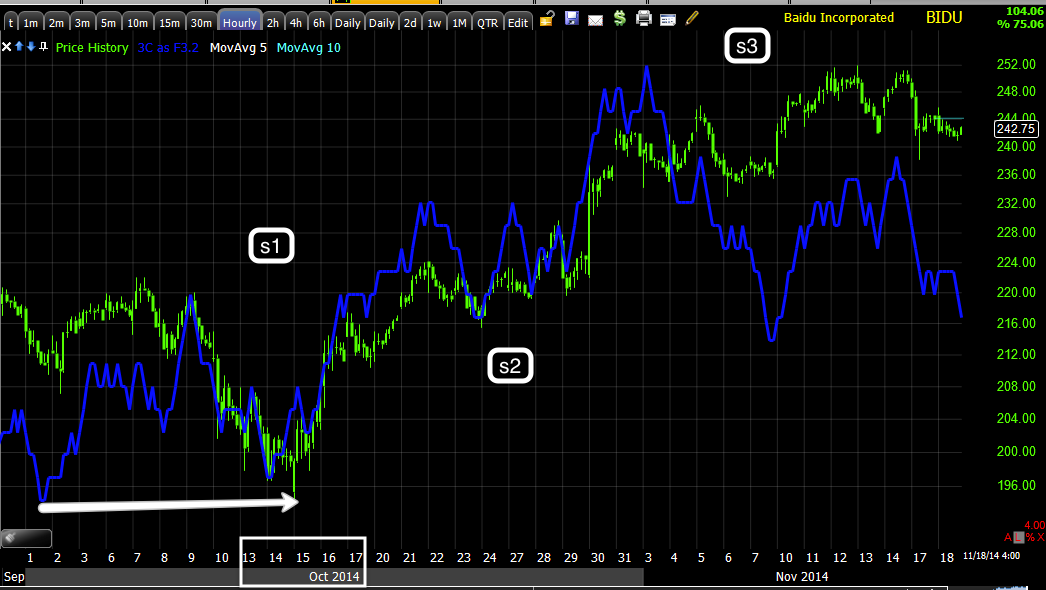
On BIDU's daily chart you can see the second positive divegrence in 2013 which I labelled "S1" for "Stage 1 bottom", the positive divegrence is easily spotted and on a chart this long with a divegrence that big, you can expect a strong trend to follow at "S2", stage 2 mark up or rally.

Note how price starts to increase its ROC at the orange arrows, just like on a micro basis with BABA this past week, it means the same thing on a long chart as a 15 min chart or a 1 min chart, the trend is getting ready to change and 3C is in a clear leading negative divegrence just as it is at the same place on the 3-day chart.

As a core short position, these are two of the main reasons I'm interested in BIDU as a core short, the largest divegrence in almost 9 years is distribution. In other words, BIDU is capable and probably going to produce a large downtrend well worth trading on a long term basis.


 Just so you can see some 1-day divergences at work, recall AAPL and the distribution we saw in to new highs? IT happened that Third Pointe's Dan Loeb (fund manager) had been distributing AAPL and when all of the other hedge funds found out at the highest highs, AAPL lost -45% from there in 8 months, but note the size of the divergence, it had been under distribution for a while.

This one we were right on top of, in fact I was short and tried to trade around an expected bounce and missed a good deal of the downtrend, which has changed the way I look at core positions.

Just to give you an idea of what size divergence on a daily chart produces what kind of move.

 The 2 hour AAPL shows the right side of the 2013 divergence, that's as far back as I can go in history. I labelled it "S1" for stage 1 base and "S2" for stage 2 mark-up, stage 3 top follows and stage 4 decline, that's the cycle of a stock's life.

The 2 hour chart which is a very strong timeframe in its own right, capable of showing primary trends is sharply leading negative, the same area as the 3-day chart and 1 day chart.

It should be pretty clear by now why I and others am interested in BIDU short for a long term position.

Shorter term...
 The 60 min chart shows the accumulation or stage 1 base of the October cycle which ran from early October until mid-October, this is where the VIX Term Structure indicator inverted with a buy signal, where VIX showed a sell signal on our Custom DeMark inspired buy/sell indicator, where I posted, "Book mark this post, I guarantee this move will be so strong , a face ripper, you will not want to consider shorting in to it".

Stage 3 "top" should be obvious not only by the 3C chart, but the price pattern itself. This is why the staging is so important, you have to know where you are before you can determine where you are most likely to go.

I can't scale the 5 min chart out any further, but it should be scaled out further which would put the first negative divegrence in September and 3C closer to price and the current 3C level would be significantly lower, a leading negative divegrence in to the October cycle's top.

As I showed this afternoon in the GLD post, Trade Idea (speculative) GLD / DGLD
 ,  something started moving quickly that looked to move multiple assets, but small moves, but likely sharp moves.

I saw the same in Nikkei futures, TLT, TBT, numerous trade assets, but all of these were late day/afternoon divergences and sharp ones on short timeframes.

The only thing I can think of that can do that and take advantage of it is High Frequency Trading. I don't suspect it's standard, large institutional money in any way or Leading Indicators and breadth wouldn't look the way they look,  but with the F_O_M_C minutes due out tomorrow, volatility in front of them, at them and after them is a virtual certainty.

I suspect the move ends badly not just because of leading indicators, but if it were meant to be a larger, longer move, there would have been stronger, longer accumulation of it.

If you needed something stronger as a reason, then the trend of leading indicators is more than enough.

This is a late day positive 1 min divegrence in BIDU, it is very sharp, yet it is very small and only on a 1 min chart.

While this could play out numerous ways, my best guess is a Key-1-Day Reversal which would mean a gap up above today's close and intraday high and close below today's intraday lows, essentially a huge bearish engulfing candle.

The late day accumulation would make sense for the gap up , although it's not such a large position that it couldn't be distributed quickly, I'd guess easily in an hour, but more likely in to the F_O_M_C minutes release in the afternoon.

A Key 1- day reversal here would make sense with all of the indications from the Nikkei to Leading Indicators and breadth which are far beyond what I can recall as far as the size of their divergences implying a move far beyond what we've seen since using them.


This is what a Key-1-day reversal would look like on the SPX...
A perfect example of an Igloo top with "Chimney" or a head fake move, after 6 days of the SPX closing in a 3 point range , that seems like more than coincidence, especially the day BEFORE the F_O_M_C minutes and if you forgot, the last F_O_M_C was taken very hawkishly by the market so I doubt the minutes will be received well.

The red candle represents a Key 1-Day Reversal, also a head fake which I'm posting next for you.

So far this is my best guess/thesis to this afternoon's strange behavior in numerous assets.

BIDU Example Coming

I think this will be a pretty good rough sketch, try to catch this post coming.

F_O_M_C Minutes Shakeout

I'm seeing quite a few strange charts, the Futures are one...the averages intraday are another, Gold and it's very interesting divergence, now in treasuries.

I haven't put all of the pieces together yet, but it looks like some kind of shakeout , most likely having to do with the F_O_M_C minutes release tomorrow.

Whatever it is, Leading Indicators and the charts today would imply VERY strongly that it doesn't end well for the market and several asset classes, GLD may be one to pop after the shakeout.

These charts are fast developing and rather new as you saw with GLD so I don't think they last long, as for the end result, I think leading indicators tell that story otherwise they'd be moving up today to get ready for it, but since they are largely institutional assets, they can't move that fast and would be in line with the end result.I'll try to get more and put this together, but here are a few charts... The last F_O_M_C was hawkish, the minutes therefore are not likely to be market positive, but AS ALWAYS, BEWARE OF THE F_E_D KNEE JERK REACTION.


 ES TODAY WITH DISTRIBUTION THROUGH THE WHOLE MOVE, A HEAD FAKE MOVE OBVIOUSLY AS THE ROUNDING TOP IS AS ROUNDING AS YOU GET (Igloo/Chimney) and the distribution on the move is there, confirmation of a head fake move.

TF doesn't look good today either, nor do the charts of the averages.

TBT, 2x short TLT looks like it is set for a small pop, perhaps pre-minutes release, but like GLD, it looks like a small move, though sharp, just like a head fake.

The Nikkei 225 futures have seen distribution through them intraday, but more importantly was the dead cat bounce off Sunday night's carnage.


This is the 5 min NKD chart, at the green arrow is the dead cat bounce, note the leading negative divgerence, it looks like it ends just as expected Sunday night, the macro trend reasserts/asserts itself.

I'm considering entering or backing up the truck and filling out short positions, the Leading Indicators as mentioned would obviously be the strongest clue as to how any volatility shakeout would end, however many top reversals are Key 1-day reversals which require a gap up and a close below the previous day's lows, so I think it m,ay be wiser to wait for tomorrow, although in the big picture it probably doesn't matter much.

As I said, a lot of these signals are new and sharp, but short, I'll look around and try to give you a best guess of what this is, first evident in the GLD charts, but I suspect a shakeout/head fake that doesn't end well on the minutes release.

Trade Idea (speculative) GLD / DGLD

This is an interesting one, especially ahead of tomorrow's F_E_D minutes.

It looks like GLD is going to see a quick move to the downside, I suspect after that, it makes a move higher. I am opening a speculative half size DGLD (3x short GLD) trading position), although it would have to have a pretty tight stop, likely a bit above below DGLD's intraday lows and then consider, if everything goes as I suspect, a UGLD long (3x long GLD).

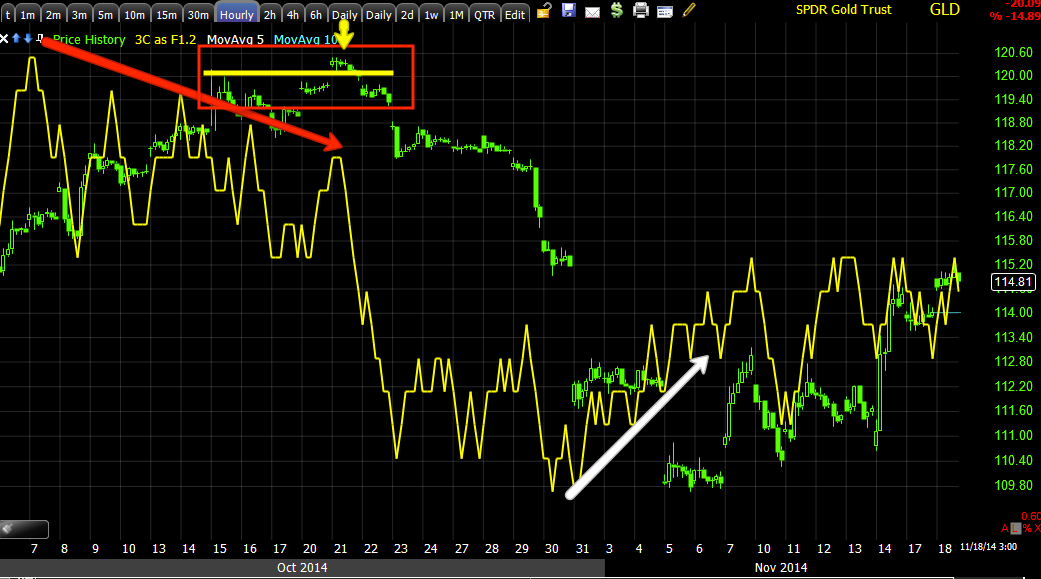
Here's the charts, the negative GLD divergence is sharp, but not very large which is why I suspect it's a quick, sharp move, but not a long one.

 GLD's negative divegrence gapping it down and a 60 min positive that has been in line since.

 The same on GLD's 30 min chart so there's multiple timeframe confirmation.

And the 15 min chart shows the same with a positive divgerence at the lows and in line. The fact there isn't a negative divgerence on the 5 min chart suggests to me any downside move can't be that big, it can however be sharp.

 The 5 min chart in line, The fact there isn't a negative divgerence on the 5 min chart suggests to me any downside move can't be that big, it can however be sharp.

 Here's where it gets interesting, the 2 min chart intraday has essentially fallen off a cliff.

UGLD, the 3x long GLD chart's 5 min is close to in line, but has a small negative divegrence today.

And the 3 min chart has fallen off a cliff.


Leading Indicators-Intraday

There are quite a few posts of the Macro divergences in leading indicators so I'm not going to be posting those anymore unless there's a material change, it's the short term timing indications I'm most interested in now.

Although there are a number of macro leading indicator posts, the most recent was yesterday so if you need a quick reference, this has quite a few, although many Leading Indicator posts also contain the macro divergences/dislocations.

As per the last post, A Number of Intraday Indicators Are Turning, here are the charts mentioned, I wanted to get it out quickly and attaching charts would have added 10 minutes.

 Although the SPX move is about +0.65%, not a huge move in itself, compared to 6 days of range bound closes in a 3 point range 2038-2041, today's move is very parabolic even if relative, although I'd call it parabolic o its own and whether up or down (like the Nikkei Sunday night when I mentioned it too was too parabolic and likely to see a dead cat bounce-just being consistent with parabolic moves), I never trust parabolic moves, they tend to end in similar fashion as they begun, with a reversal and similar momentum.

This also is a very clean and high probability head fake move, typically 80% probability of seeing one and the more obvious a  range or resistance level there is, and the more watched the asset, the more likely the move so 6 days of SPX flat is a perfect fir for a head fake move and thus far it seems to be confirming as such.


 I had to go to the macro chart on the SPX/RUT Custom Indicator because it is newer, it's in red and it tends to confirm or not confirm price movements, it should make similar new highs or lows. There's a clear macro divergence.

Also in white as part of this screen is the VIX term structure which is inverted when we have white candles (although the indicator itself is hidden here), this is a buy signal, the last one was at the August lows and here at the October lows.

Now a closer look at SPX/RUT indicator...

 This is a recent trend


 This is intraday, it is NOT confirming the SPX's move higher and instead divergent, it tends to win when there's a discrepancy between it and price.


 This is SPX (green ) vs spot VIX (blue), VIX "should" have made a lower low approximately as large as the arrow from the SPX's trendline (white) to price, it did not as VIX is still being bid up (protection from a downside move).


 VXX short term VIX futures are showing the same thing, as much as SPY is above the white trendline, VXX would normally be an equal distance BELOW its white trendline. Again VIX is holding up and has been as it is catching a bid/protection, basic supply and demand dynamics.

 The intraday VIX futures for the first time in as long as I can remember during the October move are positive (relative) on an intraday chart, they have been positive on macro trends like 60 min , but now they are finally moving to the short term timing trend/ time frames.


TLT (20 + year bond fund) usually moves opposite the SPX as seen here (I backed the chart up a bit), however today, the flight to safety trade is rallying WITH the SPX...

Here's TLT (blue) vs the SPX green, this is not normal and causing the 30 year yield divergence.

As mentioned, Yields which typically pull price to them like a magnet are dislocated intraday...
 30 year yield today vs SPX, again not normal and yields tend to win this dislocation.

 This is the 5 year, it's close from yesterday  is at the red hash mark  to give some perspective and the SPX's close from yesterday is at the green hash mark.


 And HYG/High Yield Corp Credit was used as a lever even though it's macro divergence is even larger than this, but I wanted to show it being used as a support mechanism for the market to the left, since it has been in full retreat and added a new low today.

 As well as HY Credit... Today which wants NOTHING to do with this move.

The trend here is important as well for context...

This is the macro trend

Finally Pro sentiment which has been on the run in a massive macro trend.

 Intraday it wants NOTHING to do with the SPX move

Nor does our second confirmation version.

A quick look at the average which have had all day to confirm, they are not, quite the opposite.

 SPY

QQQ

IWM


A Number of Intraday Indicators Are Turning

Since we already have the macro charts, which are pretty easy to remember as we have not had such large macro divergences since I can remember (since using leading indicators), I'm looking mostly at intraday ones.

VIX futures have held up better than they should and refuse to make lower lows, there's still a strong bid for protection holding them up.

Spot VIX is the same intraday, it should have made lower lows which it isn't, again bid for protection is holding them up.

TLT is rallying with the SPX, "Flight to Safety Trade", this is causing a large divergence between 30 year yields and the SPX which has been following them like clock work. 5 year yields are also divergent intraday, big time, this market looks ready to collapse right here at this point.


HYG is in another massive intraday divegrence as well as the huge macro trend divergence, the risk asset of High Yield credit (like stocks are a risk asset), wants nothing to do with this move.

High Yield Credit also, a risk asset, wants nothing to do with this move.

Professional sentiment are not only negative on the macro trend and intraday, but they are in full retreat intraday, a huge intraday divergence.

I suspect we are very near an intraday downside reversal. I'd keep an eye on the intraday NYSE TICK.

I'll post charts, but wanted to get this out quickly in case anyone is day trading.

BABA Channel Buster Follow Up

While I haven't called this out as a specific trade, I know some of you have taken it as a short in to at least a pullback based on the Channel Buster concept so in a way, I'll be updating this as a position also for those of you who have emailed me about it.

There are 4 posts covering BABA since last Monday, the first is the most important and if you are not familiar  with the Channel Buster trade set-up concept (or analysis), then this is the one you'll want to make sure to read,

Monday November 10th as BABA was still in a strong uptrend with no technical signs of a pullback, Alibaba (BABA).

Tuesday November 11th, BABA pulled back the next day -3.87% after the post Monday (above), BABA Follow Up . In this post I expressed the idea that I'd like to see BABA run sideways from there for a few days so we could asses whether or not it was a worthwhile short candidate for a pullback.

The pullback itself was to (and still should) whether BABA is still as strong as it has been, whether it is worth a long position on a pullback (lower prices, better entry & lower risk) or if something has changed in BABA after a pretty parabolic move up, in that case a larger trade set-up/short. BABA headed sideways in a range for 4 days since Monday the 10th.

Wednesday September 12th, BABA Follow Up  At this point we established where the Trend's stop was via the Trend Channel, where the moving average defining the trend was (60 min 30-bar) and where it would head after breaking the 30-bar (to the 60 min 50-bar), all of which happened, but the most likely concept was a deeper pullback on a Channel Buster move, which is a sharper, deeper reversal.

As explained in Monday's first post when BABA looked like this in a seemingly strong move on heavy volume, which we see as a warning flag of a change in trend imminent...
 BABA as of our first post Monday 11/10 and the Channel Buster and the most likely price resolution as this "seemingly" bullish move is actually a bright red flag.

BABA since...
The very next day BABA pulled back almost 4%, it broke our Trend Channel stop for this uptrend, the 50-bar and 60 bar moving averages and now has broken clear through the channel.

On Friday 11/14, I posted BABA Trade Set-Up with the lowest risk entry, which was the day of the small Doji after the big decline (3rd day back). I'd have preferred to see an entry above the recent range as that would have increased the risk/reward ratio and lowered risk on the trade.

Some of you have taken the short since and this morning BABA broke the lower channel, hitting the stops we expected to find there. The lower channel was at the psychological $111 whole number...

 A channel buster almost always hits the bottom channel as a minimum target, but often takes out stops below the channel as it did this morning (stops are also within the channel for shorter term traders.)

You can see the tail take out $111 with a low of $110.41 this morning

On the 60 min chart you can see the lower trendline and the increased volume as $111 was hit at the lower trendline.

While a Channel Buster is its own unique concept and they work for up channels, down channels and breaks below an up channel (running above the channel before collapsing), THESE ARE PART OF THE WIDER "HEAD FAKE" CATEGORY OF MOVES. The increased upside rate of change and breakout from the channel "seems" bullish, but it's a  change in character that is a red flag for a trend change, whether a simple, but deep pullback as the Trend has already been broken, or something else, that's what we determine next and decide what type of trade BABA is offering.

 The X-Over Channel to avoid false moving average cross-overs or whiplashes shows the trend hold with one whiplash that remained long the trend until the red boxes.

Since there's not enough trade data to construct the same moving averages yet on the daily, this is what the daily would look like, 2 of 3 indicators are long and typically the first pullback after a long signal is to the 10-bar (yellow) moving average, however the blue 22-bar is not that rare and is often the second pullback area which would also complete the Channel Buster move to the most often seen pullback, below the channel. Playing "Devil's Advocate", those stops were hit below $111 this morning.

 The Trend Channel that had held this trend on a 60 min chart also broke.

Since we don't have enough data to construct a trend channel on the daily chart I've widened out the 60 min. Trend Channel, for those following along, move the AVGC from 10 to 30 and the timeframes of 11 to 31 and widen out the Channel Width to 30 (3 standard deviations).

The stop on a close would be $112.86 and this would be a serious breach of the trend.

As for 3C...
 As I said in the first post, BABA is very strong, this 2 hour chart shows that, although you can see recent damage, it does not rise to the level of a stock I'd consider a core short, in fact it looks repairable from here.


 The 10 min chart is what we had to go on as of 11/10, this divergence told us we'd be seeing a move lower, but since it has ,moved to near confirmation, although still in a leading negative position, again it can be repaired, but thus far the repair or a strong enough signal to take BABA as a pullback long is not there.

 The 3 min chart goes from in line, notice it is in line longer than the 10 min chart which is divergent long before-this is the same concept I have been talking about all morning with longer charts divergent and then the shorter charts move divergent as "timing" charts.

So far it is leading negative since distribution at the top and still in line.

If I was short here, it would be a coin toss as it was never expected to be more than a pullback trade, but a stronger channel buster type. If I were looking for a pullback long, I'd stay patient. If I were to stay short, I'd be watching every indication closely, especially longer intraday candlesticks that might put in bullish reversals like a 15 min, 30 min or 60 min and on rising volume.

The most telling indication right now is the 1 min chart which is negative, almost as a perfect timing indicator, now you know why it was so important for me yesterday to be watching for 1 min signals in FAZ today, but at the run of $111 stops, there's no accumulation of them yet which leads me to believe it is not done on the downside.

If you need an update on the stop channel or the 1 min chart, just email me.

I believe there at least 2-3 very strong trade probabilities here, it just depends on what the next candle/day or so does.