Monday, March 16, 2015

USO / Crude Oil Update

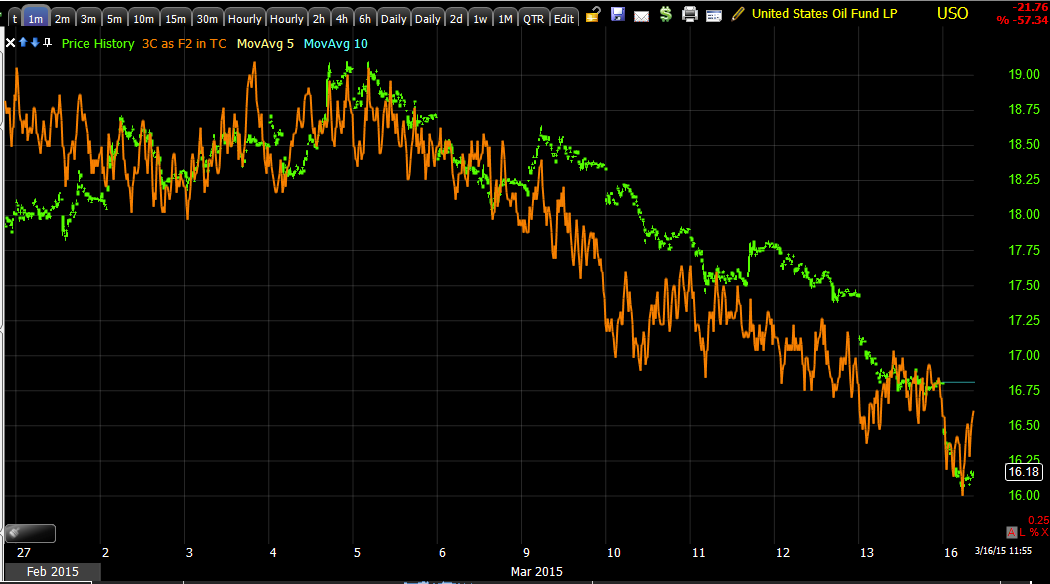
This is Friday's USO Update , it contains charts and excerpts from updates earlier in the week such as Tuesday and what we anticipated oil would do next, thus far it has done exactly what was anticipated since the probability of a large primary trend base started to over take the probabilities of a shorter term counter trend bounce that would leave the primary downtrend intact after the bounce.

There have been many theories as to why the price of oil declined from imposing a kind of sanction on Russia, an oil exporting nation for their actions in Ukraine and Crimea to that act being driven by the US and suddenly turned on the US by OPEC/Saudi Arabia to crush the ?US Shale Oil Industry who can't produce a barrel of oil for what the current market price is, thereby wiping out the US shale producers and leaving OPEC and some other large non-OPEC producers in complete control of supply and demand once again. An advisor for the Saudi minister of petroleum recently went on record about reasons given to the Bank of England's Mark Carney when he asked 1) What caused the price decline and 2) where oil prices were going. The answer about what caused the price decline seems to be, "I
t was all perception and conspiracy theory, herd mentality that secret actions were being taken to hurt one country or crush another's oil producers and he claimed it was all non-sense conspiracy theory that had actual results as we know all too well, Perception drives prices, rarely is it fundamentals and as to question #2) While the general answer was "If I knew I'd be in Ls Vegas", the broader sentiment was hopeful for the future of oil prices stabilizing and rebounding based on real supply and demand fundamentals. To me, all of this makes about as much sense as the F_E_D tightening policy right now (as I have said, I don't think the F_E_D should be sitting at 0% rates for the last 5-6 years), but on a macro data basis, if one looks at things objectively, it's hard to justify a tightening cycle based on the horrible macro data since Q4 2014 through present. Yes the F_E_D's current policy is that of EMERGENCY action and no we are not in an emergency situation, therefore some balance seems reasonable, but the way things are going, it doesn't make a lot of rational sense to tighten right now as everything in the US and globally has weakened and the F_E_D inflation forecasts have been dead wrong for 2+ years now.

That being said, it seems they are and have been on a course of tightening, they have tightened just by ending QE and it seems they will again. The point is, it seems the F_E_D is much more worried about something that's not out in the main stream press, unless the macro data coming in as bad as it has been is the answer hiding in plain view. Meaning the F_E_D's policy is so wound up, there's no room to deal with any new recessions or economic shocks, therefore they maybe need to create some room or they simply see or are worried about something that we are not privy to. In the same way, I don't know what really caused oil to drop as it did, I only know that SOMEONE knew in advance and someone seems to know now in advance.

 This is the daily chart of USO and the price decline. If the current lateral price pattern we can observe through most of 2015 were a consolidation phase, we'd expect to see lower than average volume, instead we see much higher than average volume which as you know, is most often associated with a reversal.

For instance, just like our candlestick (reversal) concept and higher volume making those signals more probable by 300-400%, the same is true of oil, you just have to look on a larger timeframe like monthly...
The last time oil saw a major spike in volume it wasn't on a decline or a consolidation , it was at a bottom in 2009 similar to the same volume pattern playing out now, although without the same history (yet) seen in 2009.

As for conspiracy theories, I don't know and beyond simple curiosity, I don't care. The market told us back then that something was not right with oil, someone knew something whether it was part of one of the conspiracy theories or something else altogether than we haven't heard or.
 The 2 hour 3C chart has one of the worst divergences in oil I may have ever seen including the 2008 top and it's at an area in which there was a top price pattern (H&S top), someone knew something and was getting out of the way, clearing out their longs, establishing shorts so this wasn't some innocent misunderstanding of perception.

In similar manner, the current signal is the polar opposite. While the pundits either call for lower prices and celebrate as oil moves lower or they call for a bottom and are heart broken as they see oil move lower, we've had a different perspective, one that we just saw on an intraday basis in the SPY and QQQ last week leading to today's price action. The concept is EXACTLY the same, the timeframe is different, a "W" bottom. The 3C chart above suggests that someone with deep pockets believes or is making sure this is a bottom and I know of investors that have large oil tankers sitting off the coast just holding oil and waiting for prices to rebound so they can start selling them so they obviously believe for their own reasons.


 This is a close up of the 2 hour chart. Since we had called for a break below a descending triangle last week and prices have moved that direction, this chart hasn't moved, that's simply because to move a chart like this you need to have a huge amount of accumulation or distribution. If our theory about a wider base or double bottom was correct/is correct, then we wouldn't expect to see accumulation until we reached the area of the first low which we just hit today, therefore accumulation if anything, would be just starting and certainly wouldn't be reflected on this long of a chart. The other side of the coin is the decline we have forecasted and seen, is also not creating large distribution. If you are a large firm or "Deep pockets", you don't want to give up the shares you accumulated on the cheap if you are only half way through your accumulation. Unlike us, they can't place a full order for a full position size at once without sending price way against their position and having every predatory algo and every human trader with half a brain front running them, it's done in pieces which is why we call it a "Process", not an event like our smaller orders would be considered which have no effect on the market.

 This 30 min chart is going to move before the 2 hour chart, but the point is the same, it doesn't require as much accumulation or distribution to move, but either way, it hasn't moved suggesting this is a larger base being put together, but we are just now reaching the accumulation area and it hasn't begun in earnest yet to the point in which it would move a chart this large which is still quite a lot of accumulation/distribution to move. By the same token, the downside move we forecast to make a "W" base hasn't caused any noticeable distribution which would appear here a lot earlier than a 2 hour chart. IT seems our theory is right, at least as of now.

If you note the trendline, I also forecasted that as with almost all double bottoms (like a "W" except larger) we'd see a head fake move BELOW support, this is where I'd want to buy USO or add to it , but this is likely to be a process as well in line with the size of the base, not a 1-day event.

On a 15 min chart we can see the signals that moved prices from accumulation at the former lows to an area of resistance at the red trendline with a negative 3C divergence, part of the reason we expected a move lower and this to be part of a larger base so both sides of the "Oil is going lower and oil is basing and going higher" are correct and both are wrong, they just can't see the picture we can see which is, "Oil prices had to move lower to form a larger base to support a move higher".


So far intraday, price is in line with the move down we forecasted below the descending triangle, meaning the accumulation cycle of the second area of the base hasn't started to any large degree yet and CL /  Crude futures confirm the same.

The 1 min CL chart shows a negative intraday divegrence to send oil lower to the area we forecasted.

How can we play it from here? Well first we have to confirm our theory is correct, but thus far everything I see says it likely is and we need to get signals strong enough that they move the 15 min , 30 min and maybe even the 2 hour charts. This is not going to happen in a day, probably not in a week, it is a process and you can probably gain some insight as to how long it will take by looking at how long the first area took and imagine the symmetry of the price pattern, they tend to have symmetry. Don't forget the head fake move. In order to steal shares of the long who believe oil is headed higher, they'll have to scare them out of their shares which means creating a head fake move lower that is scary enough to cause the emotional response to activate and sell the shares on the cheap,  this is where I'd like to be a a buyer, so you can use your own emotional response to price as a barometer, if it scares you and makes you doubt any base is possible, it's probably the right area to buy, but these responses are extreme to knock out the hardest core longs.

As for where oil is going, I can't say beyond making a price pattern based guess, but with a primary trend reversal, I think that guess would be on the low side. Who knows what is causing smart money to accumulate, perhaps they know something about future opec plans which may be to say, "Hey, there's so much oil in reserve, we can cut production down to a trickle because if we don't, they can just sit on those reserves of cheap oil for a long time and no longer need to buy from us" as the reservoirs are nearly full in the US alone.

Thus, this may have NOTHING to do with global growth and demand and everything to do with production quotas being severely cut. Whatever is going on, there's a reason for it and someone knows why, we're just trying to follow that someone and we'll understand later , hopefully after we are sitting on a large profit why exactly price reversed higher as I anticipate. Again, just a point of interest by that time.


Market Update, All is not what it seems

Looking at price percentage gains themselves this morning, it looks like our "Week Ahead" forecast is right on, early strength,  but beyond that, rotation out of the Russell 2000 and in to the SPY/QQQ; this is evident from price percentage gains themselves with the IWM under-performing on a relative basis.

However under the covers, things are more interesting than I expected them to be this early, except maybe the IWM.

Lets start with the SPY,

SPY intraday struggling to confirm...

SPY 2 min also showing the same, in fact all the way out to 3 min. This is either an arbitrage reaction intraday to the slight weakness below in EUR/USD or it's selling of price strength, this is the first time since last Monday there has been any price strength available to sell in to in SPY.

The Q's are showing the same thing...
QQQ intraday failing to confirm. Remember what these look like as you'll see the IWM below.

While these are intraday and not really any threat to the forecasted early strength as there's a larger divergence powering this move or gas in the tank, it is indicative of how higher prices are being treated, or possibly the correlation, but I suspected the former over the later.

The intraday NYSE TICK reveals breadth is nowhere as strong as you'd expect for the price percentage gains of 1%.
While not horrible on the downside of TICK at -500, the upside has only made a couple of brief forays into the +1000 zone which is the low end of extreme, in other words, not very impressive.

Last week there was a high, high degree of cross asset correlation and it's here this week too.

The recent slowing down of momentum can obviously be attributed to one of those assets, the EUR/USD...
 intraday 1 min EUR/USD with a negative divegrence and the correlation with Index futures (ES)...

You can see EUR/USD vs ES (purple) has had some effect on recent momentum and 3C intraday signals.

HYG, the ramping lever which does have some gas in the tank and could lend some support, thus far has not.
While the area at the white arrow may provide some intraday support, thus far HYG is red on the day. I would expect HYG to diverge from the averages first as it has done, but I wouldn't have expected it so early.

As for rotation, well you can probably see the IWM or Russell 2000 futures are struggling beyond the price divergence with SPX/NDX...

 This is the intraday TF/R2K futures 3C chart, compare to the ES/SPX futures below...

Looks a lot weaker than ES doesn't it, this is likely the rotation taking place.

And the IWM intraday as I mentioned to remember what the other averages look like intraday...
IWM 1 min intraday looks much worse than just non-confirmation and some slight distribution in SPY and QQQ, this looks like it could turn down as I have suspected and rotate out, it allowed higher prices to be old in to last week, it may be the SPY and QQQ's turn with IWM actually diverging beyond relative performance and actually in to the red. If that's the case, then there are some positions I'd like to get set up early in IWM.

I'm looking at more cross asset correlation as that was where we found the most revealing signals last week, really toward the end of the week, but it looks to be carrying through to this week as well. Take a look around at other assets, even loosely correlated or seemingly connected ones, I think you might be surprised how much information they are willing to share if you just look.


A.M. Update

Good Morning, I hope you had a fantastic weekend and a great week ahead, MAKE IT SO!

As to mine, check the bottom of the post and there's a mystery question...

As for futures, they're right in line with the first part of the Week Ahead forecast from Friday, which is early week strength including right up to the F_)_M_C announcement on Wednesday at 2 p.m. being the SPY and QQQ had never left their bases last week and gave the market nothing to sell in to, in fact they were right in line with last week's forecast of early strength (Monday) and continuing weakness the rest of the week which they all saw except the Russell 2000 which did see distribution as it DID give the market something to sell in to. I also expect relative performance rotation out of the IWM/Russell 2000 and in to the SPY/QQQ in the first part of the week.

Futures are said to have rebounded overnight on EUR/USD strength or support after the $1.04 handle was broken and rallied off it, but I suspect this was all in the cards well in to last week and this is just more 30 second soundbite justification so people can understand why the market is doing what it is doing which is far from understanding what the market is likely to do before hand, but it gives people a sense that they have some control over the market in understanding what it is doing rather than what it will do.
EUR/USD overnight after having broken the $1.05 support again (same as last week) and found support to bounce above $1.05, this is the reason being given for this morning's price strength even though we expected it as far back as Tuesday of last week and reiterated it on Friday's Week Ahead forecast.

Of course the main attraction this week is the F_O_M_C meeting in which it is widely expected the phrase or word, "Patient" with regard to rate hikes will be removed and every headline scanning algo has already been programmed to look for the word, "Patient".

As for the market and picking up where we left off, you already saw these charts last week, but it's worth a quick overview...

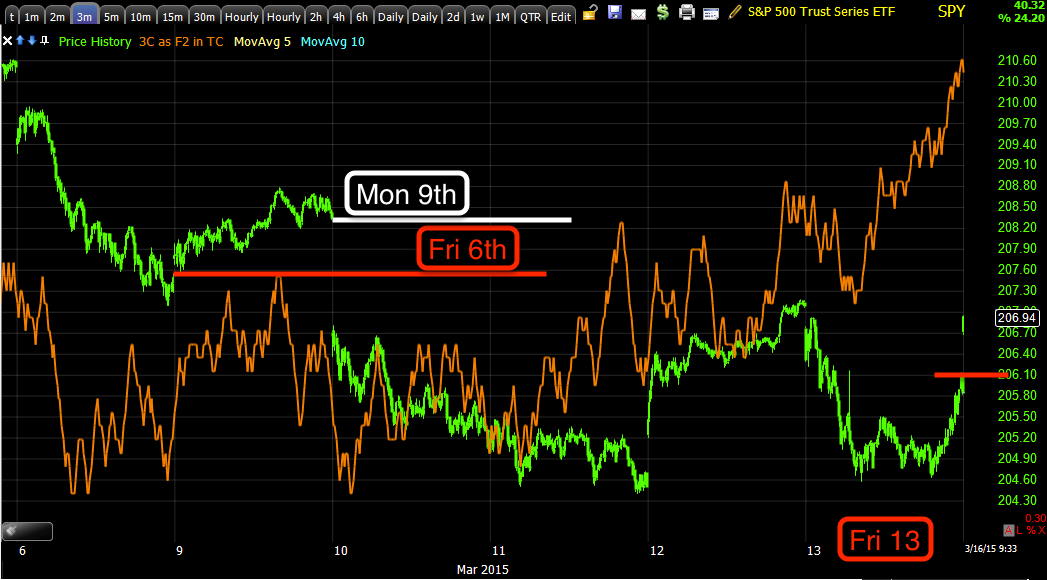
 Friday the 6th's close and early strength last week on Monday the 9th as forecasted with continuing weakness (price) in to the rest of the week, Friday the 13th closes lower on the week.

The same chart without all of the scribble and a clear "W" base that SPY never left, never gave the market a chance to sell in to any strength so this morning's open isn't a surprise in the least and picking up where it left off essentially.

As for IWM rotation, unlike the rest of the averages for the most part...

It not only saw price strength Monday, but formed it's base starting Tuesday when we started closing down QQQ and AAPL puts and expecting a bounce and Friday when UVXY long was closed preserving a +10% gain to re-enter at better levels like the QQQ/AAPL puts.

The 10 min chart shows the base and distribution in to higher prices which is why I suspect rotation out of the IWM and in to the SPY/QQQ/DOW.

The Russell 2000 futures show the process more clearly...
TF 7 min "W" base last week, bounce and distribution in to higher prices, something the SPY and QQQ couldn't achieve last week. Note it's the same kind of "W" shaped base, pretty common in these waters.

In fact on an intraday 1 min basis since the new week, last week's forecast which was put out before Friday as I suspected it would look like Friday's forecast a bit earlier is seeing confirmation already in the intraday charts.
 ES 1 min for this week's start to futures is in line with only a very small 1 min negative right now, not quite enough to do any significant damage.

NASDAQ 100 futures 1 min look the same for the new week's futures trade, but...

TF/Russell 2000 looks quite different, so this will be one of the first places I'll be looking for opportunities if I feel that it's not just relative weakness, but an actual top for the IWM, then puts would make sense or inverse ETF's or simply IWM short.


Once again, see if you can spot the odd chart out and why I suspect rotation which is not generally good among the averages (it's great among industry groups) looks so plausible...

Spot the odd chart out (10 min Index futures)

 ES 10 min

NQ 10 min

TF 10 min

Pretty easy huh?

As for Gold and oil, well they are right where we expected them to be and getting more interesting by the day, I'll be covering these today...
 In January we called for a GLD pullback and a probable long entry after it completed. Does it not look like a selling/capitulation event on the break below support a little over a week ago and a base building bit of price action since?

As for USO, we called for a larger base which meant price would have to move toward the January lows, even a specific call for a break below the descending triangle and what do we have, oil right where we expected it, now to confirm accumulation of lower prices.

As for the event of the week, I don't know how the F_E_D will defend raising rates or even removing "Patient" as even this morning's Manufacturing output fell for a 3rd consecutive month, a big miss and back to Lehman levels.

Thus if the F_E_D does hike rates, in this environment, they are doing it for a reason they have not clearly stated, something they are more worried about than what a rate hike will do to already very weak macro economic data not just in the US, but globally. I wonder what could be so scary to them?

In any case, hopefully we'll start to get more clarity as more pieces of the puzzle are revealed.

As for my weekend, I went to work with Andrea and have never seen such a massive gathering of humans...

 THis is Calle Ocho (with the Miami skyline in the background) , a traditional Miami latin street festival in March which I believe translates in to SW 8th Street, which is where it has been held for over 30 years.

Hint, the line of people you can probably make out upon closer inspection stretches way past the bottom side of the picture and ends where the red arrow is at the top of the picture. As far as how many people...? All I know is they hold the world record for longest congo line of some 120,000 people!

And this is our bird's eye view.

Lets get to work!


Friday, March 13, 2015

Daily Update - Beautiful Cross Asset Correlation!

Although lasst week's "Week Ahead" post was pretty darn close with early strength on Monday as we saw, I always will change my analysis if I see a good reason to do so. I'd much rather that I didn't have to, I'd rather say to you "Everything we forecast last Friday happened exactly as we forecast", but that  is just not realistic and I owe it to you to change or update my analysis when I have information that has changed. The stock market being virtually one of the most dynamic organisms in the world is prone to changes with notice and some with little notice.

As you know on Tuesday when I closed the QQQ and AAPL put positions, Closing Down the AAPL and QQQ Puts for now, there were reasons that were logistical like the time decay, but there was also an updated near term forecast for a bounce this week which strangely we really only saw in the Russell 2000 and Dow to an extent, the SPY and NASDAQ never really left their base area.

As explained with example charts from the September high to October low period, a bounce at this stage of the current short term trend is nothing unusual at all, it doesn't tell us the market is up to a distraction or anything of the like.

All in all though, our analysis wasn't far off.
We were looking for early week price strength on Monday and as you can see by all of the major averages for the week, that's exactly what we got. Additionally we were looking for weakness in to the rest of the week.

Only Transports and the Russell 2000 closed green on the week, all of the other averages were in the red. In general this has been the worst 2-week run for the market since early December, why do you think that is? Hint... What stage did we just hit?

The Dow, SPX and Transports are all red for 2015 and NASDAQ and Russell 2000 aren't far behind.


For my part, typically all of my hard work is at stage 1 and stage 3 trying to pinpoint reversals, at stage 2 advance and stage 4 decline, we are already in positions and riding the trend on auto-pilot with little to do other than position management, but something was different for me this week.

As you know on Tuesday when the bounce idea first started taking shape, most of my reasoning was based on price action, volume,etc.; more or less gut instinct that is based on years of watching how the market behaves. The objective data like 3C charts were sparse, a few hints here and there, but nothing screaming.

While we had some intermediate trend 3C signals by Wednesday, there was an odd opaqueness to the market, short term signals were all over the place which is very unusual as the market typically moves together and typically confirms together, that wasn't the case on Wednesday as I mentioned. By Thursday we had a monster move in the IWM relative to all of the other averages, this is like the Dow Theory of Transports/Industrials confirmation, the averages should have moved together much more than they did and it was a red flag the same way Transports have not confirmed the broad market on a larger trend basis.

While the market was a bit more opaque and ambiguous than I'd like, I think our basic trading plan was for the best which should have kept you out of a meat grinder in most of the averages, given you an edge and high risk:reward entry should the market have made a reasonable bounce (otherwise not putting on any risk unless the position came to us) while booking some shorter term trade gains:

+22% in AAPL March 20 puts, +48% in QQQ March 20 puts and +9.5% in the March 2nd UVXY position.

Don't be nervous about what I'm about t tell you. There was something in market trade in underlying trade that was unusual, I'd call it "unfamiliar". I thought a lot about this, looked at many different charts and indicators and even considered creating a more basic version of 3C which is just tweaking the settings a bit to remove noise and expose trend, however in the end I scrapped that as I don't believe in fitting indicators to specific circumstances, it's over-fitting and it does not produce a robust indicator and carries the danger of cognitive biases with it.

It was actually today in which I thought about the possible answer to the short term chart anomalies. First I thought that maybe it was F_E_D leak related, lets face facts, they have done it several times before and have even been questioned as recently as the last Congressional semi-annual testimony a couple of weeks ago about a leak from 2012 that has not been investigated or acted on and we probably all remember the early (1.5 day) release of the F_O_M_C minutes by email to 154 big banks and private equity firms, not a single one of which reported receiving the minutes a day and a half early and strangely receiving them by email when this information is supposed to be released to everyone at the same time.

No, rather I ended up with a different theory. I have grown use to the market and underlying trade with the F_E_D's nearly $4 trillion dollar balance sheet expansion since 2008 when it was less than a trillion. I have grown use to how the charts look in QE periods and even since QE ended, but the one thing that I haven't seen in more than 7 years is how the underlying trade/3C charts look like in a true bear market, those are memories that I have, but are over 7 years removed. I do know and remember that assets and underlying trade act differently in different market stages and they do even more so in a bear market vs a bull market, it has just been a long time since I've seen it in the broad market. 

The degree of cross asset correlation is pretty spectacular and as I said earlier, a MACD histogram on price simply won't cut it anymore, you have to work for the message of the market.

The EUR/USD was a big mover and influence for the market as today it broke the $1.05 support as sell side firms are quickly changing their forecasts for parity, moving them up of course.

 EUR/USD since last Friday as it takes out $1.05 support today.

EUR/USD (candlesticks) vs ES (purple) since Friday.

Pretty amazing correlation and it needs to be watched as there are clues everywhere to near term action.

Take the $USD component of the pair...
 I have inverted the $USD's price so you can see the correlation vs the SPX.

This is the same on a larger scale, it seems $USD strength is calling the market lower.

As for that strength...
 This is the best weekly performance for the $USD (this week) since September of 2011.

 On a 2 week basis, this is the best 2 weeks for the $USD since Lehman in 2008.

As for the other half of the FX pair, the Euro (FXE as a proxy)
 Here the Euro can be seen vs the SPX intraday, look at the weakness in the Euro this morning and the reaction in the SPX and note the rally in to the close which was accomplished via a VIX slam to lift Index futures to VWAP at the close.

And the longer perspective of the Euro vs the SPX at the February cycle, again, the market has some catching down to do.

As for the VIX or VIX futures...
 I've inverted the SPX price (green) so you can see the correlation vs VXX (short term VIX futures), note the weakness yesterday in VXX and again today, again the correlation through multiple assets is quite amazing.

This is the late afternoon VIX slam that lifted the market  to VWAP at the close...

 Es 1 min lifted right to VWAP as were Tf and NQ at the close today, all via a VIX smackdown.

As to spot VIX (inverted SPX), you can see the relative weakness yesterday and today again.

Although I did close the 2x long VXX at the close today, I still like it, just short term I'd rather take the gain.
 1 min VXX, the 3C divergence is pretty obvious and the fact they used it to lift the market in to the close is near indisputable when you see the 3 min VXX chart below...

VXX 3 min. Because this is leading negative, I decided to take the +10% UVXY gain short term as I suspect I can get better positioning, however I really wouldn't have lost any sleep over holding it.

VXX 15 min with a beautiful base and divergence with confirmation throughout. Below is the inverse of VXX, XIV which trades with the market.

This is the 60 min XIV negative leading divergence so on a longer term basis, I really like VXX/UVXY long, I just wanted to preserve the gains and look for a better entry, same as the AAPL/QQQ puts.

There's strong data for early strength in to next week as was our forecast from Wednesday, a bounce in to the F_O_M_C, but the caveat may be that the Russell rotates out which I'll show you.

As long as we are still looking at near term leading indicators, 
Our SPX:RUT ratio has been leading the market since Tuesday when we first started closing puts and continues today, so I suspect a bounce in to early next week of the F_O_M_C, I'D PREFER TO SEE IT EARLY IN THE WEEK WITH CLEAR SIGNS ITS ENDING BEFORE THE WEDNESDAY 2 PM F_O_M_C. If this is the kind of bounce we get and signals, then our original assumption of squaring positions , selling longs and opening shorts before the March meeting would make perfect sense, if it runs any longer than that, I'd suspect there may either be a F_E_D leak or they're trying to paint perception through price movement like what happened with NFLX on earnings, but like NFLX, that only works so long as we entered NFLX short right at the top Feb. 26th, at an +8% gain.


As mentioned HYG (blue) has been in line with the SPX until this morning as it gapped down and the market wasn't far behind, however as of this afternoon at the lows, there were several short term positive divergences so I suspect as I said above, early price strength, but largely in the other averages and less so in the R2K.

Yields on the long end lost 11-14 basis points this week which means all of the losses since the Non-Farm Payrolls have now been erased.

 30 year yields which move opposite treasuries (or ETFs like TLT) have been a great leading indicator (red) vs the SPX above, as you can see wherever they didn't confirm, the SPX followed yields lower.

However just as VXX was distributed this afternoon above and HYG accumulated, TLT saw short term intraday distribution to send yields higher and help with the afternoon bounce and probably in to early next week.

 TLT 3C chart leading positive at Friday which sent it higher and yields lower this week, pressuring the market as well, but you can clearly se the negative divergence short term.

The correlation is amazing, this alone would have been reason for me to close UVXY despite the different asset classes because of the amount of correlation.

As for the stronger TLT chart and the bigger picture for the market beyond early next week...
This is the 10 min leading positive in a big way meaning TLT up, yields down and the market following yields like a magnet.

Even commodities which are likely acting as well as they are as a leading indicator not only because of economic (global) weakness, but because the legacy $USD arbitrage is starting to work again now that the F_E_D isn't printing trillions.

 Commodities (brown) diverging vs the SPX (green) intraday and leading lower, however that didn't work in to the close today.

As for the bigger picture and the February cycle, commodities led the market at the Feb 2nd lows and in to the stage 3 top, they are certainly leading in to stage 4 decline.

Gold is one that's starting to get more interesting and we'll be looking at it more closely early next week as well as miners, I haven't covered GDX, NUGT and DUST in a while, but with GLD starting to get interesting, it's time to take a closer look.

As for oil/USO, you know what we expected earlier this week, we got exactly that, if you need to catch up with forward expectations, check out today's post, USO Update.

As for some of the divergences in the averages, I tried to cover as many as possible today, here's an interesting look at the divergences in the Index futures and particularly how it relates to our proposed rotation out of Russell 2000/small caps and in to the SPX/QQQ for early next week... Pay attention to the different Futures in the same timeframe. (*I've used ES or NQ vs TF in most cases rather than both just so we don't have 20+ charts)...

 ES 1 min with the same positive divergence at the end of the day to rally to VWAP at the close as we see in TLT (negative), VXX (negative), HYG (positive), the averages, TICK, etc. The cross asset correlation once again is almost a work of art.

NQ/NASDAQ futures 1 min intraday show the same positive divergence in the afternoon, note the negative on the cash open as well.

 However when we get to Tf/Russell 2000 futures, they look a bit different, leading negative in to the a.m. session well before the cash open and in line at the close, no positive divergence.

 ES 5 min, look close to the far right and you'll see a leading positive divergence in to the close today.

However the same timeframe in TF is purely negative and leading negative at that.

NQ 10 min shows the positive I suspect we'll be seeing early next week after negatives that were forecasted last Friday in the Week Ahead post.

However TF is clearly leading negative on the same timeframe.

ES 15 min has a positive divergence and what looks like a small "W" base as does NQ, this is why I think we see price strength early next week although we forecasted that Wednesday.

 TF shows its positive divergence it rallied off this week , also a "W" bottom/base and now leading negative since.

Every timeframe ES and NQ look similar, TF is the direct opposite leading negative.

Thus the rotation out of small caps and in to SPX and QQQ early next week seems high probability, there are several trade ideas I have in mind, we'll just see how the intraday charts act.

ES 60 mins which has been guiding us and telling us the Feb. cycle would fail as the SPX retraced all of it this week has a small positive to the far right, this is within a larger leading negative divergence, (multiple timeframe analysis), thus I still think early strength before the F_O_M_C is most probable.

However at a 4 hour chart, the NASDAQ futures above are leading negative like the 60 min chart above this.

While volatility "could" run over these divergences, I think there's so much cross asset correlation, it's literally a thing of beauty if you take the time to make all the connections above.

there's clear evidence that this is a bounce and that it fails, I suspect it runs (as you know) right in to the F_O_M_C Wednesday at 2 p.m. or thereabouts, I'll be looking for distribution in to any price strength to confirm.

The only other possibility I have considered is that this is a perception set up as no matter what the F_E_D says, no matter how hawkish, people follow price for their perception just like we saw on NFLX's crappy earnings, however that only last so long as there's a purpose, in NFLX's case, to let middle men out of losing position in a sharp earlier gap down. This I feel is the least likely probability, but if it is a probability we should know early in the week as we should be seeing distribution as soon as we move past the "W"W base, something the SPX and QQQ didn't do this week, only the R2K gave the market something to sell in to and they did as you can see on the charts above so I suspect the second possibility re: F_E_D perception set-ups is a distant second, but again, we'll have a clear idea as soon as we have price gains in the market.

There's no Dominant Price/Volume Relationship today. As for sectors, 9 of 9 S&P sectors closed red with Health care performing the best at -0.19% and Utilities performing the worst at -1.02%.

As for the 238 Morningstar groups, only 35 of 238 closed green.

THIS IS A 1-DAY OVERSOLD CONDITION and as such a bounce in to next week (early) is right in line with these readings.

I don't think there's much surprise as this is what we have been forecasting since Wednesday, however the Russell 2000 rotation which was more theory now has some solid evidence for relative under performance, maybe even red.

That's going to be it for today, I'll be checking futures Sunday night and post anything interesting, but I think we have a good opportunity here to let the trade come to us, reset those put positions, the VXX/UVXY long positions and even core/trend short positions.

Have a GREAT weekend!