Today was a bit of a challenge, I had the A.M. post just about ready to go out and apparently someone took down a Comcast cable junction station with their car, shutting down both TV
(you know I can't miss my CNBC update in the morning SARC.!!!!), but more importantly the internet, so I packed up 3 computers and a 4th monitor and headed over to my back-up location which is with another provider (Bell South), thus a few changes to the A.M. Update as charts changed from pre-market to the cash open.
Whether good, bad or indifferent, I have been BLESSED not only to do what I love, but to do it with the most incredible group of people as members. I've told you this ad nauseam, but I say this for a reason, which is I'm very comfortable being extremely open and completely transparent with members/friends as I'm sure even the newest of members knows. As a 1-man band, you can't simply take the day off because you have something to do.
Tomorrow I'll be working from another "strange" location, the Boca Raton Regional Hospital.
Some of you old-timers may remember several years ago my mother had kidney stone symptoms and an ultrasound or MRI (I can't remember which) revealed a large cancerous tumor on her partial ovary (whoa, I know that may be a little too personal). It seems "back in the day", they use to leave a part of the ovary in during a Hysterectomy. I really don't recall if it was successful in bypassing menopause as I had a very different interpretation of the word at my age then
(Men you WILL PAUSE) and my mom seemed a lot more ignorant back then
(I'm amazed how much she has learned since)- so who knows? In any case, she had Laparoscopic
surgery to remove the tumor (state of the art equipment), except for one thing... apparently the surgeon left a clamp inside her which turned a 3.5 hour surgery in to a 9 hour surgery as they searched for the missing clamp through the small openings they had made Laparoscopically.
After hours of searching (
I had no idea what was going on sitting in the waiting room and posting about the market other than she was in several hours after the surgery was scheduled to end),
the surgeon ended up cutting clear across her stomach to find his clamp, a wound that took nearly 6 months to heal. You may recall I moved in to do her bandage changes and walk her 4 dogs (yeah, she's almost one of those ladies).
Getting to the punchline, that large incision apparently never healed correctly and turned in to a Hernia with 4 strangulation points which can be life threatening; so after several months of telling her she WOULD NOT BE FIT FOR SUMMERTIME IN FLORIDA AND A BIKINI, she finally acquiesced and is having the surgery...TOMORROW. We have to be at the hospital at 9:30 a.m.
I'll be working from the hospital tomorrow, everything should be the same, unless something goes wrong, but I figured I'd give you a head's up and ask for your thoughts and prayers, but I'm quite sure she'll be fine, but unlike a margin call, you only get 1 mother.
As to the market today...
If you read this weekend's posts or just kept up with the Daily Wraps over the month of April (
this post is a much more succinct way of catching up, Important Market Update Part 1: The Forecast which will bring you up to speed on what we expected as of April 2nd and if you feel up to it, Sunday's 2nd post of the weekend, Important Market Update Part 2: The Forecast Plays Out & The Beauty of the Market which shows where we are since the forecast) you'll probably understand today's weakness in terms of the April 2nd forecast of not only expected price movement and why, but what happens to the market during this phase and how that leads to what comes next.
On Friday I posted how it would be just like the market to let some new highs stand through the weekend to gather in the retail crowd that has to place their orders Sunday night or Monday morning before heading off to work. The breakouts from triangles were clearly engineered
as shown as early as the April 2nd forecast before they were even definitively revealed as triangles. The same forecast also gave the probabilities of what would happen in to such a situation and why, although there's no replacement for the two posts linked on the member's site:
Understanding the Head-Fake Move... How Technical Analysis Went From an Asset to a Trap
and
Understanding the Head-Fake Move... Motivation
(If you have read them, great, but like many books, sometimes a few months/years of experience gives the same words new meaning. If you haven't read them, then you are missing out on two of the most important posts I've ever pecked out).
Just as I found the CNBC article and JP Morgan CNBC interview, both pointing to these triangles that we saw a month ago well before any one was talking about them and had already made a forecast as to what to expect from both price and underlying trade/indicators through the anticipated theory that is now fact, I'm still surprised with the ignorance of commentators like STA Wealth Management.
These are the guys who are supposed to be on their clients' side and maybe a
"little ahead of the curve" , yet they are still penning ridiculous stuff from
what technical analysis was 15 years (or more) ago before everyone was using it and before Wall St. took advantage of the fact that everyone was using it and how predictable that made everyone. Do technical traders REALLY believe that Wall St. doesn't understand Technical Analysis and isn't way ahead of the curve, using these (in some cases 100 year old )
concepts against them?
As a quick example, here's STA's take on the market and the triangles, which is the EXACT same as CNBC's and JP Morgan's, the only difference is that both CNBC and JPM were firmly biassed toward these being bullish triangles (as would benefit both of them) and STA is firmly biased toward the same concepts that I read about nearly two decades ago and were published almost a CENTURY ago!
"As shown in the chart below, the market has been remained trapped in a tightening pattern of higher lows and lower highers (YES, THAT'S CALLED A TRIANGLE). This type of action is like the compression of spring. In the next few days, the markets will make an important decision. A breakout to the upside of this consolidation will confirm the current bullish trend, and portfolio actions should remain allocated and tilted more heavily towards equity related risk. However, a break to the downside will likely suggest a more significant correction in the near term. It is worth noting that this consolidation in the market is happening during a decline of relative strength. This is a warning sign that generally bodes poorly for the bulls."
Seriously? I wonder how much they charge their clients for this tid-bit of Technical Analysis DOGMA that has been in circulation AS IS for decades, AROUND THE TIME OF WWII!
Do they REALLY not get that Wall St. figured all of this out when cheap online brokers caused a flood in to Technical Analysis in the 1990's and these concepts or rather DOGMA, have been around for numerous decades and are used ROUTINELY against technical traders because even a Wealth Management firm like this, is still stuck in the old ways of TA from decades ago. I really don't get it, how these people get clients to turn over millions/billions to them for reciting the first technical analysis concept I read when I was 21!
At least in their article they get to something less dated like Dr. Alexander Elder's "Come Into My Trading Room" (circa 2002) and point out an RSI/MACD divergence.
Wilder's RSI and a MACD Histogram vs the SPX. A bit less dated and somewhat relevant, but that's not exactly analysis I'd want to count on being everyone who has spent more than a year in T.A. or read more than 3 books, is well aware of these concepts. "TO MAKE MONEY, YOU HAVE TO SEE WHAT THE CORD MISSED".
In any case, one of the few redemptive qualities of their analysis was to mention that the March NYSE Margin Interest has hit all-time NEW RECORD highs as print last week . This means the market is now the most leveraged in its history. This means should things go wrong for bulls, the snowball effect of margin calls will create a self-fulfilling prophecy of downside panic as a net Credit balance or investor worth is at all time record lows.
I'm sorry for that interlude, but I just can't believe a wealth management company can actually be in existence with so little knowledge of how the market works. I knew more about these technical concepts by the time I was 25 (almost 17 years ago) than they seem to exhibit as a "wealth manager " in publication on the net!
On to something our own...
If you read the weekend posts, you'll see not only did our forecast come to be just about exactly as forecast, but the internals, 3C signals and leading indicator degradation occurred as well giving credibility to the forecast that the breakout above the triangle's would be a head fake or "False breakout", one that is used to attract retail traders, but one that will not hold.
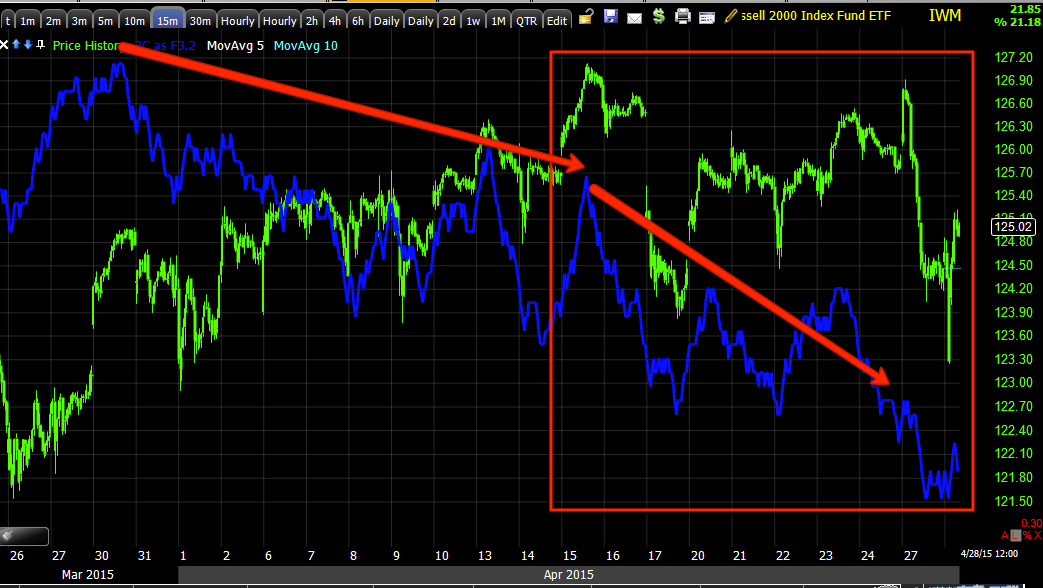
Small caps underperformed large caps today which is a message of the market in itself. The Russell 2000 should always lead a risk on move, perhaps that's part of the evidence pointing toward a head fake move from the April 2nd forecast as the IWM was the only of the 4 major averages, NOT to have a 15 min positive divergence like the rest.
The major averages today with the Russell 2000 in yellow and transports (IYT) in salmon. Otherwise the other averages remained fairly tight knit
(SPX-0.41%, NDX -0.26%, Dow -0.23%, Transports (Dow-20) -0.86% and Russell 2000 -1.17%).
Earlier Futures reflected rumors and hope that the Greek situation "may" be resolved after Varoufakis was soundly criticized as an amateur and time waster at Friday's European Union Finance Minister's meeting in Riga on Friday. It seems since then, Greek P.M. Tsipras has held private calls with Chancellor Merkel and President Hollande assuring Varoufakis be sidelined as Greece HAS run out of money and is resorting to absconding with local government and cities's money to pay huge salaries and pensions due at the end of the month not to mention 2 large IMF payments in early May, with NOTHING to show from negotiations accept the EU-wide opinion that Greek fin-min Varoufakis is a time-wasting amateur. Of course he's only representing the wishes of Greek PM Alex
Tsipras' and the party's election campaign pledges.
Early futures action was on Chinese "consideration of Q/E" while these unsourced rumors were rebutted by an actual PBoC economist saying China was not in need of any great measure of stimulus...
Futures rise on China QE rumors, (un-sourced as usual), then on Varoufakis being sidelined in future E.U. Finance ministers' meetings. Then a sharp sell-off on the US cash open.
It seems the early USD/JPY Yen correlated algos switched on around 6 a.m. had little to no effect on price action the rest of the day.
However despite the early correlation between USD JPY (candlesticks) and ES (purple), The FX pair failed to hold futures up as selling set in,
However as shown in this morning's
A.M. Update, ES remains significantly over-valued the USD JPY correlation which undoubtedly is reflecting the unwind of the carry trade.
30 min ES vs. USD/JPY with ES still over-extended from the carry correlation.
NASDAQ Biotechs were taken to the woodshed today after a recent Channel Buster...
NASDAQ Biotech's Channel buster on volume (daily).
"Changes in character lead to changes in trends". Note once again as usual, the "seemingly" bullish upside above the channel is actually a red flag. See volume.
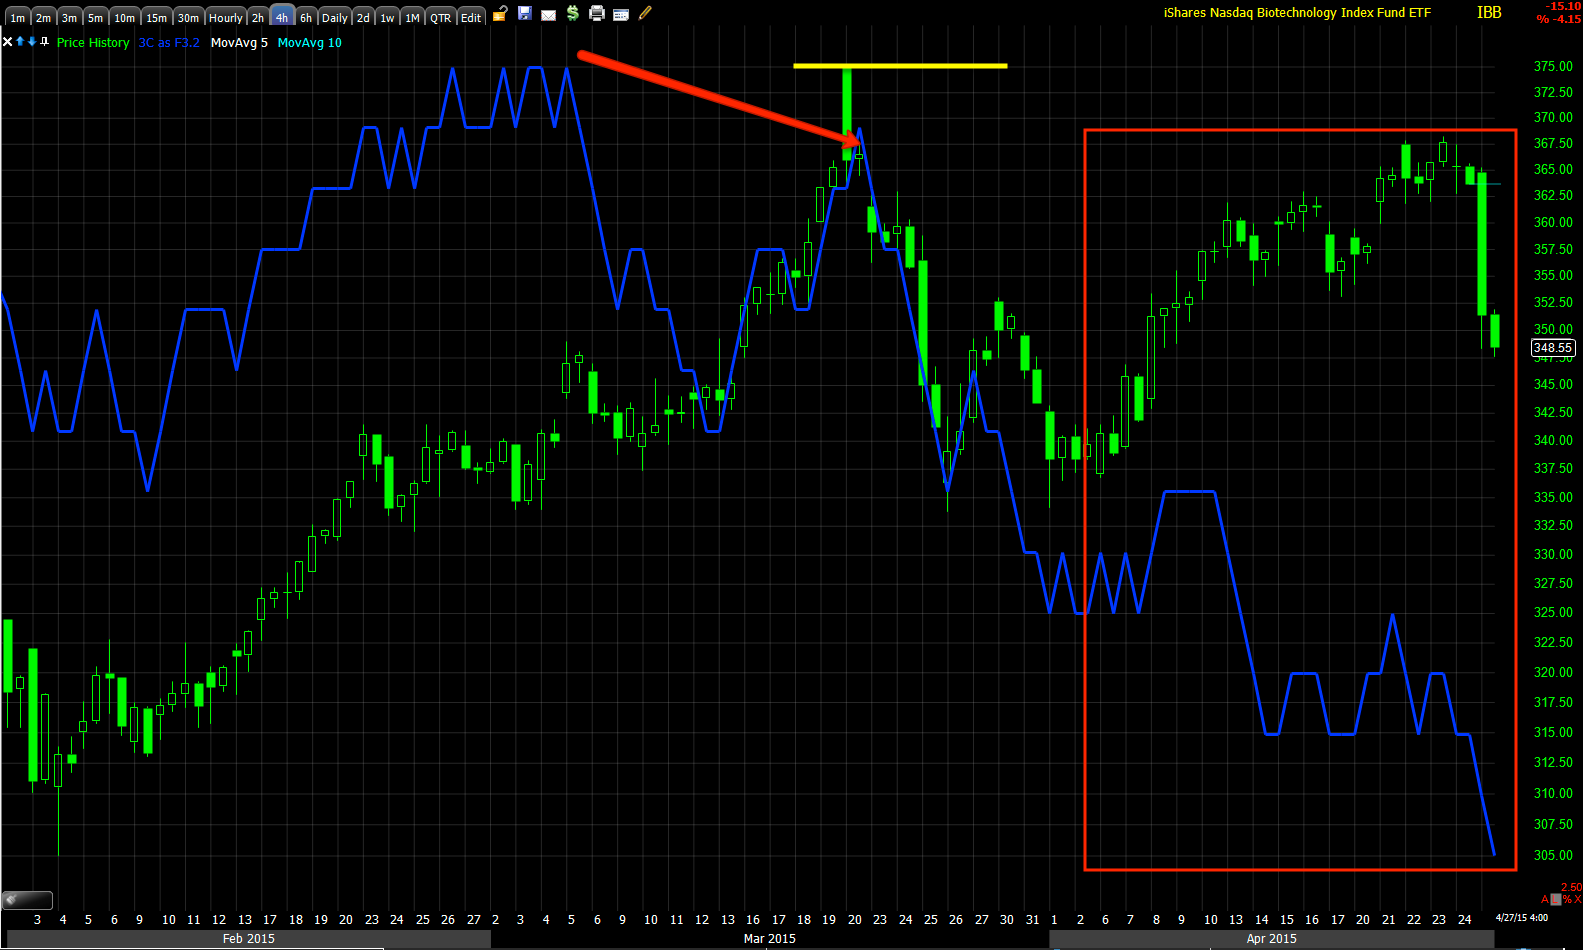
The NASDAQ Biotech index closed down -4.17% on huge volume to the 50 day m.a. on the biggest daily hit in over a year. Again, changes in character lead to changes in trends. Volatility as evidenced by this channel buster and decline is clearly picking up,
something we have documented before every change in the market's trend. There's still plenty of time and positioning for a core Biotech short, another one of our favorite positions.
Like transports, biotech's are a favorite Long term Core short trade as seen by the divergence on this 2 hour chart and the failure to make a higher high.
30 min IBB distribution.
However, like transports I am not chasing price weakness as the intraday charts show positive divergence like transports (2 min) suggesting a better entry in the near-term.
IBB 5 min positive for a near term bounce. This is what I want to short in to.
Despite the intraday divergences pointing toward a bounce,
SERIOUS DAMAGE WAS DONE TODAY AND COLLECTIVELY.
QQQ 2 min positive at the EOD suggesting a bounce.
QQQ 3 min migration showing the strengthening of a bounce divergence intraday.
QQQ 5 min intraday positive also suggesting a bounce likely tomorrow.
However, long term damage is without question, done...SPY 60 min.
Leading Indicators are depicting both near term bounce probabilities and bigger picture damage. If you saw this weekend's posts then you know what the trend in leading indicators has been since the April 2 forecast, as well as the 3C charts for the averages and 3C charts for index futures (
all declining).
One of the most reliable, which forecast the bounce, the SPX:RUT Ratio. Today I saw significant damage in this indicator.
On an intraday basis note the extreme rate of change today.
To put this entire trend into perspective, this shows the leading positive indication into the April 2nd lows at the "W" base. Note the divergence as SPX breaks out of the triangle in today's increased ROC of the indicator on the downside making a new low for the trend
(compare to the weekend post).
High-yield corporate credit has been supportive it has recently turned to the downside as 3C charts have predicted.
However intraday high-yield credit remains in a supportive leading position, in line with an expected short term bounce.
Yields such as this 30y, which act like a magnet and pull equities toward it, were in line to the downside with the SPX.
However, looking at longer-term yields or the bigger picture, you can see how they were supportive at the green arrow, in line with the SPX. Since then, several negative divergences have appeared and a much larger leading negative divergence is in effect.
The bond market closes at 3 PM, I took TLT(20+ year T-Fund) and inverted its price in red versus the SPX. At the end of the day you can see TLT supportive of a near-term bounce.
As for internals, they too are supportive of a near-term balance as in tomorrow.
The dominant price / volume relationship came in at Dow 14 stocks, NDX 51, R2K 952,, SPX 218. This is a dominant price/volume relationship which came in atClose Down/Volume Up.
This relationship is a short term oversold condition, Not the kind of oversold that is represented by indicators such as RSI, but much more accurate based on market breadth.
The most common bias is for a next day close higher, in line with our 3C short term indications.
In addition, since the close AAPL came in with a solid earnings beat, one of the assets I looked at today and saw the probabilities of a bounce like most.
AAPL gains in AH on an earnings beat...
As for futures tonight, they are not showing much except in the NASDAQ 100 futures as might be expected.
NASDAQ 100 futures one minute with a leading positive divergence since the close.
I'll check features again before I have little doubt that we will have a balance tomorrow Setting up numerous positions such as IYT, IBB, NFLX, etc.
Have a great night, Unless something happens and futures, I'll see you in the morning.








 | Theme by Thur