Tuesday, May 12, 2015

Market Update

The theme of the day today has been building a base that can hold a bounce and that the market needs to come down to allow the charts to strengthen (accumulate on the cheap as is smart money's way). There are quite a few different trade ideas we can go with, but the market needs to come down first.

In to the close, we have pretty decent signals that this is what will happen, whether in the overnight session or tomorrow or a bit of both...

 QQQ 5 min intraday negative near term

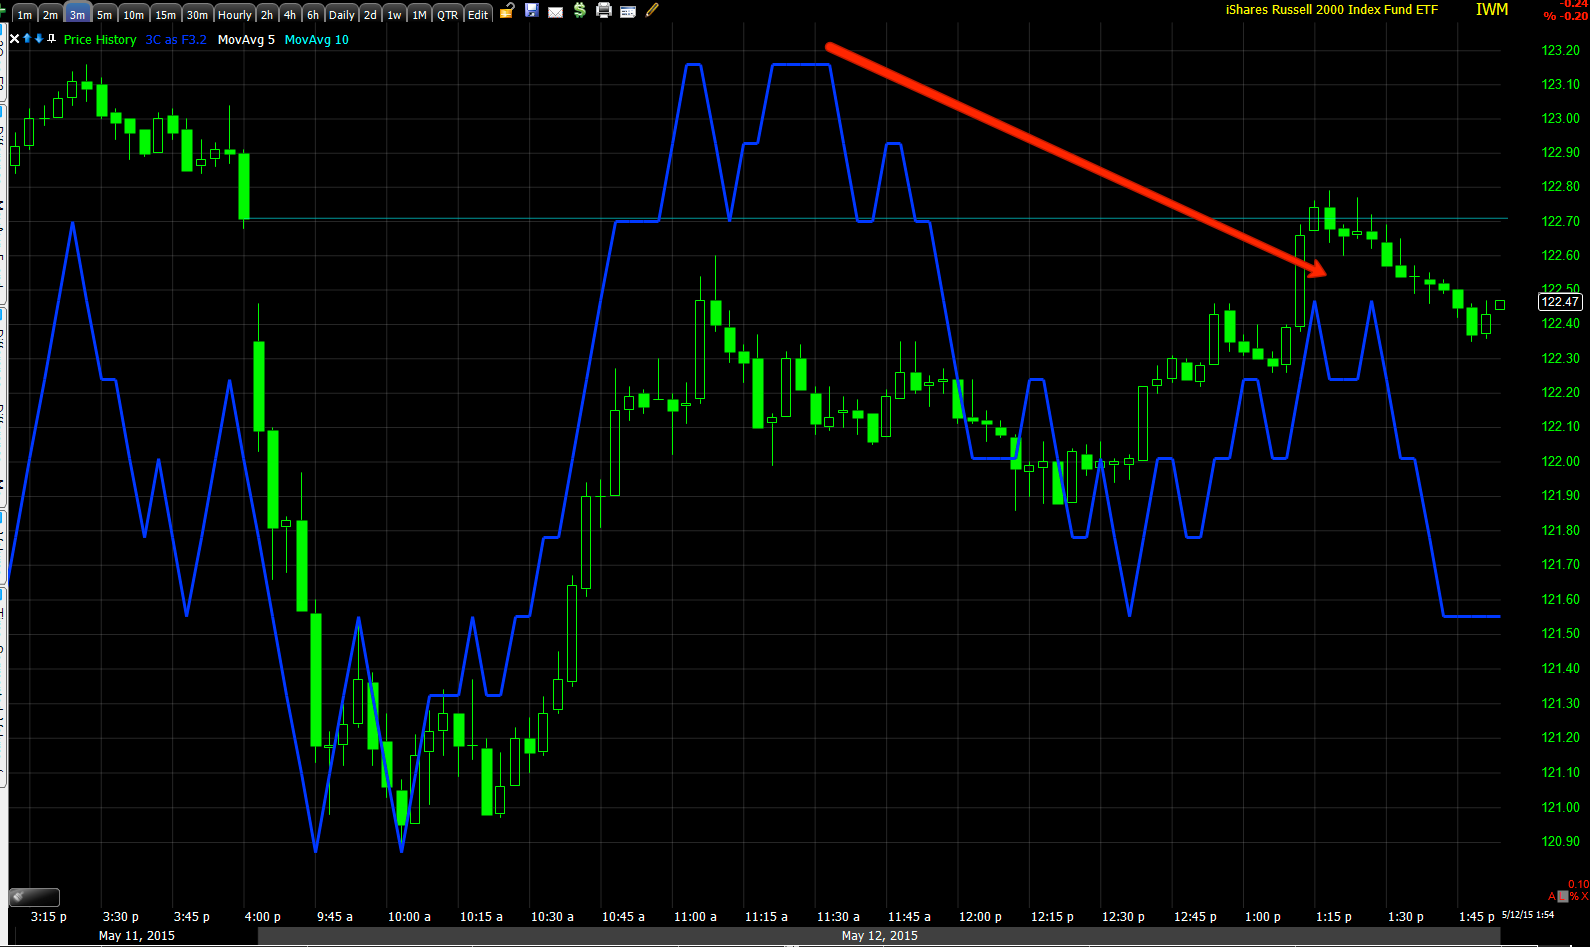
IWM 5 min intraday negative near term

ES/SPX futures 3 min intraday after accumulation at lows this morning.

NQ/NASDAQ 100 futures near term negative after accumulating lows this morning.

TF/Russell 2000 futures negative , again after accumulating the lows this morning.

It is this same accumulation of lows which would improve the charts,  but as I have been saying all day, "Price must come down".

I have a trade set-up coming out next in Gold/GLD and then I'll tie all of this together in the Daily Wrap, you'll be surprised as it is one of those beautiful market moments like a ballet when everything just slips in to place.

Quick Update

As was my opinion in the last market update, my opinion remains the same, the market averages have to come down from their current intraday levels and do some more work on their base before they can bounce and while it may or may not be a strong bounce or just a stronger move within the recent loitering chop, we'll have to wait on the charts to give us a clue as they straighten out as they need to in order for a reasonable trade to be taken.

I looked at some different assets and as I concluded last week in the Week Ahead forecast and as I have been arguing for most of the year, the $USD is very important and has a direct correlation to bonds, equities, a slightly leading correlation to gold, etc. I'll show you this.

THIS IS ALL CARRY TRADE RELATED AND YOU CAN LOOK AT A FEW $USD CHARTS ALONE AND SEE WHICH WAY THIS ENDS FOR EQUITIES WITHOUT ANY OF THE OTHER INFORMATION WE HAVE PUT TOGETHER.

I considered perhaps another VXX position (1-day short term) as I believe the market HAS to come down to do this repair work, but I don't see the charts to support a trade there and I suspect it "might" be because the moving lower may occur in futures overnight.

So for now, it's patience, I don't think we are far from some quick trades that are worthwhile or will be and not far from big picture entries as we held off on positions like NFLX over the last couple of days looking for a bounce, this should be it (As an example).

I have to gather a few more charts and then I'll post what I've found which is something we have been following for some time and more and more recently.


Quick Market Update

This is that bit about "Patience" that so often pays off.

I see signs the market is moving toward a more sustainable base that should be able to meet the forecast from last Friday's The Week Ahead post. Specifically...

" I believe  we will see early weakness on Monday. HOWEVER THIS PART OF THE FORECAST IS NEAR MEANINGLESS COMPARED TO THE REST SO I WOULD NOT GET TOO HUNG UP ON THAT.

I'm still expecting a $USDX led bounce in the equity market as well as the bond market, certain stocks are going to be shorts before others, but this gives us a chance to open or add to any positions we may want to tweak a little.

As I have tried to make clear, it doesn't look like smart money is even participating in this move, thus my own participation level is so low at present having closed VXX puts today.

In comparison to what comes next, this bounce is nearly meaningless like Monday morning's forecast."


Obviously first things are first. The early week weakness seems to have been fulfilled for the most part today, more than enough reason to take the VXX (Friday) Call position gains off the table as we did this morning...
We exited the calls with a nice gain right at the red arrow before VXX started losing ground, this exit was brought on by the loss of momentum which I never want to be caught in an options trade when that happens.

The point of the chart however is this is a 3 min VXX chart (VIX trades opposite the market). While I could see no good reason to keep short term calls that expire either this Friday or next in place, we really haven't seen that much deterioration on the 3 min chart as we might expect on a market bounce where we might consider VXX puts. With a  chart like this at present, I WOULD NOT CONSIDER VXX PUTS. Again this is not about probabilities, it's about  high probability/low risk, well timed trades with a reasonable risk:reward ratio.

That chart alone tells me something about the market. In brief, I still expect some sort of bounce in both equities and bonds (I need to do some updated $USDX analysis). The charts for the averages are showing significant improvement along the lines of the forecast from Friday, BUT in my view they are either NOT THERE YET or EVEN IF THEY WERE READY TO MAKE A MOVE HIGHER, I WOULD NOT ENTER A TRADE WITH THE CHARTS LOOKING AS THEY DO  which is to say they are incomplete. That would be a move I wouldn't trust and I like to sleep well at night.

That all being said, it's my opinion that we are in the very reversal process I mentioned first thing this morning as something that would have to occur before the market is ready so I wouldn't say there's any failure or missed opportunities, it seems to me at this point it's just the process unfolding. The main difference in market action terms is a process which is more stable vs. an event like a "V" shaped reversal that is NOT stable.

Here are a few charts showing the probabilities of a bounce and where we are in the process.

 This QQQ 10 min positive divergence is one of my favorite charts for a bounce trades. As I said earlier, I favor the Q's and IWM for any long bounce trades (kind of like what we have been doing with VXX calls/puts). However, the narrow "V" base was predictably weak and the market needs a stronger base even to pull off a bounce that is more or less in the noise "loitering" range  (A concept we talked about last week and expected to see. This typically happens at important pivots, the last good example was after the failed head fake move last September right before the move to the October lows) as these are, at least if we are to get involved with them.

 SPX triangle's upper resistance trendily was the area for the head fake, it wasn't the best head fake example, but since it failed price has loitered around that area the same as just after the September head fake (Igloo and Chimney top) move and just before the move to the October lows. I suspect this is a larger loitering range as it should be a larger primary trend move (eventually taking out the October lows).

The NDX had a better example of a head fake move/false breakout in the first yellow box to the left, it failed and then the loitering around the resistance/support area or the pivot at the top trendily. Note the daily hammer candlestick, the same is in the SPX above.

It looks a bit to me like the market wants to make a move higher here. I just wouldn't want to put money in to it at this point without some better looking charts.

The IWM 5 min also looks good, it has a better "W" base it has moved off and today's divergence looks good so far.

The SPY 10 min was close to the QQQ 10 min, it wasn't leading as much and has seen some damage since. Note again the sharp "V" bottom ,

Now intraday charts which is where most of my problems with the market right now lay...
 SPY 1 min is showing an intraday negative, it looks like it wants to come down if this holds which would probably be good for straightening out these charts and getting them in shape.

The 3 min SPY chart has the same type of signal. I simply could not go long even for a 1-day bounce with charts like this not in line with the trade.

Again though, if this is part of the process and prices come down, I would view that positively so long as the 3C charts show improvement in these timeframes.

 SPY 5 min is still in line and hasn't seen the intraday negative 2 and 3 min charts above migrate this far out so this again tells me that this is likely still part of the basing process ad there are still decent chances we can pull off some short term longs and then move to the larger trade... see the quote above from last Friday's forecast for the larger/next trend after a bounce.

 The NYSE TICK shows the second high of the day failing to exceed the first, much like the 2, 3 min intraday negative divergence at the second high of the day.

 And my custom SPY/TICK indicator shows what looks like short term capitulation of the recent weakness and a market trying to build out a base that it can bounce from.

 QQQ 3 min is in line which is a decent signal for a bounce/long, however...

The faster, more sensitive 2 min chart is showing a negative intraday divergence again suggesting a pullback in price. Again, if the 3C charts improve on an intraday pullback, I'd view that as a positive for taking a position.

IWM 5 min is more or less in line intraday which shows some repair of recent weakness.

However like the other averages, the 3 min which is more sensitive is calling for or showing a negative divergence intraday which should lead to a pullback which could be accumulated and whip these charts in to shape.

I just wouldn't trust them as they stand RIGHT NOW, even if I knew the probabilities were extremely high for a bounce, you don't want to wake up the next day with a 3% gap down on the open.

Patience...

TLT/Treasuries Counter Trend Rally Follow Up

Last week I opened a partial tracking position in TLT, I wanted to use some longer dated calls, but couldn't get them through so I needed up opening a half size position (which was the plan the entire time-calls or otherwise) short TBT (2x short 20+ year bonds or 2x short TLT) which created a 2x long TLT position essentially, Trade Idea: Long Bonds / TLT

If you read any of the posts from last week like the trade idea above or the charts/reasoning here, Bond Rally / Swing , you'll see I suspected TLT/Treasuries would come down and that is where I'd fill out the second half of the position. If you need a quick explanation of the logic of the trade idea, see the Trade Idea: Long Bonds / TLT post from last week. There's a Channel Buster/head fake, there are 3C signals, there's huge short interest for a squeeze.

I do not think bonds are going to see a primary trend reversal, I consider this a counter trend rally which will see treasuries hit a new low as the rally ends. However, counter trend rallies are some of the strongest rallies you'll see in a bear market or otherwise.

Right now in my opinion, TLT is looking a bit better or more mature in basing than the market averages, but I also think they'll move roughly in sync which IS NOT NORMAL. We've talked about the reasons, you've seen the $USD analysis, binds tend to drop on the carry trade unwind, although some think the ECB has been a bond seller rather than be stopped out at -.20% Maginot line they have. I don't know if there's validity to that , but I do believe this is carry trade related as the $USD and Yen give evidence of it.

However right now Treasuries are one of the most overcrowded shorts near the historical extremes for shorts.

Here's what we have in TLT so far. I'm not going to go too far in to Treasury futures because that's a lot of charts, but it's not just the 30 year bonds, it looks like the entire curve will rally on a counter trend move so I'm looking for an area to enter the second half of the trade started late last week as the second half depended on a pullback and I'd say we've met that criteria.

 Yesterday I posted the 60 min chart and probably in last week's posts as well linked above, it's clearly in line with the down trend, thus I don't expect more than a counter trend bounce which is not meant to belittle a counter trend bounce/rally... as I said before, these are some of the strongest rallies in a bear trend you'll see in any market trend. Look at the first counter trend rally after the initial crash of the Dow in 1929, it was a near +50% move, that is their job, to suck people back in, to make them believe. In this case the thick shorts should be helpful as well.

In any case, the 30 min positive divergence is what I was pointing out and the 3C concept of the minimum target being where we first saw the divergence which on this chart would be around $124.40 with a gap around $127. Looking at the size of the base under construction, I'd say that's probably a very realistic and easy target to hit ($127). I wouldn't be surprised if we got a move to about $128 on a volatility shakeout of technical shorts...

That's the initial break of the long term trend line that draws in new shorts and the market often runs them out with a move back above the trendily causing a short squeeze and emotional reactions. In any case, you can see why I'd prefer some leverage even with a decent technical move.

 The 10 min chart is positive on the suspected pullback from last Thursday. Look at volume, this looks like a clear head fake/stop run. "All of those shares are below to us!"


 The 5 min chart also looks good, we have nice consistency among the multiple timeframes...

And the 3 min chart including the negative divergence that formed the day after the initial partial entry as was suspected then along with a leading positive in to the recent new lows.

You can see a wider "W" shaped base with a head fake move in place so I think this is close to being ready to make a move.

 This is the 1 min intraday chart, it went positive at the lows today, but looks like a pullback intraday. I'd like to see it move toward yesterday's close or below on a stronger positive divergence and I'd likely consider that the second entry point.

The 2 min chart is showing a little migration of the 1 min chart's current intraday negative "steering" divergence, so again I suspect a run a bit lower to allow them to accumulate more at lower prices and this is where I'd like to add the second half. I suspect it will be today.

Just to show you, these are treasury futures...
 The 1 min 30 year (similar to TLT) reacting positive intraday as you see above on  the TLT charts.

 This is a 15 min chart of the 10 year Treasury futures also positive.

And a 30 min chart of the 5 year treasury futures.

I show you these because as I have said several times, this looks like a broad based counter trend rally across the entire yield curve, not isolated just to 30 year Treasuries.

I'll let you know as always once I decide to add the second half of the position to the tracking portfolio.

Quick intraday update

The market showed some extreme resiliency on very short term 3C charts, but I haven't trusted it...not yet anyway. As I was sating earlier this morning, there needs to be a reversal process, not en event and that takes a little time...

 SPY 1 min intraday saw rapid improvement.

I still think the IWM has the best looking underlying trade right now with QQQ a close second. However this early progress was too quick, too early and I wouldn't trust it.

 The 3 min SPY chart still looks like this.. In my mind, this should be repaired and positive before even considering an SPY long bounce trade. The white trend line represents the gap fill we were talking about yesterday as a target on the downside which was hit this morning as stocks catch down to bonds.

I still like the TLT/long Treasury swing /short squeeze trade, I may like it more than any of the possible equity trades that may come up. Looking at some core shorts, it's very hard to get behind any long trade right now so they'll need to prove themselves  even for a short term trade. For this reason alone I didn't trust the early improvement that looked quite extreme on 1 min charts.

 This shows what has happened since, QQQ 1 min is leading negative intraday so price should come back down and hopefully it will build out laterally and we'll see some better divergences for short term trades.

The QQQ 10 min chart marks about the size of the base that we can bounce from (from last week's "Week Ahead" post on Friday). However there's still work to be done and I'd rather sit on the sidelines than to enter a sub-par position.

I do believe we'll have opportunities for both short term bounce positions, they may or may not be in the averages and the downside divergences are just monstrous. I was looking at Financials and considering whether I might close a core short position to do some shorter term trading and just could not even bring myself to consider it.

So there's 2 or 3 probable trends all developing at once, each more probable than the next, but all probable. I'll continue to update the proper made and hopefully have a Treasury post out soon.

VXX Call P/L

The VXX calls entered last Friday, Trade Idea-EXCEPTIONALLY SPECULATIVE...VXX Short Term Calls at 3:37 p.m. were meant as a very short term position, in fact specifically for the early weakness forecasted for this week. Yesterday I decided to hold them as I did not see the weakness I expected from the signals we had as of the close on Friday, this morning we got that weakness and I ended up closing them as I usually do, as momentum starts to fade and before the first major correction.

For a trade that lasted little more than a day, it worked out pretty well and these were the longer dated 5/22 expiration rather than the 5/15 I had intended.


At a cost of $1.08 and a fill of $1.70 the P/L came out to +57% which is fine with me for this type of trade.

In any case, I'm already looking at the next potential position, I hope you did well.

Closing May VXX $20 Calls From Friday

They are just loosing too much momentum.

Opening Action....

This price decline is much more in line with what was expected for the early part of the week (Monday) in Friday's The Week Ahead forecast...
Since Friday's close, yesterday was not the kind of move I'd den worthy of a VXX call position such as the one opened Friday, Trade Idea-EXCEPTIONALLY SPECULATIVE...VXX Short Term Calls which was shortly after closing the both VXX puts around 12:30 on Friday at a gain, Taking Both VIX Puts off the Table. Again the difference between a high probability move and a high probability, low risk trade are two entirely different things so I'm happy to see this more extreme move this morning.

As we have been seeing lately, the bond and equity markets are moving together which is not usual, I suspect it's because of a carry trade unwind, but the HFTs seem to have created a correlation trade. It seems to me that equities are catching down to treasuries today...
Since Friday, Treasuries (TLT red) have led, today equities (SPY green) seem to be catching down to that correlation.

We expected both to pullback as of late last week and both to form a larger base as the "V" base in place from last week was bound to fail. Don't forget the larger part of the Week Ahead forecast which is for a bounce/bounce attempt and the even larger big picture which is a lot worse and to the downside after the bounce attempt.

For now though we are looking for the end of this move which "may" end with a flameout, a mini oversold/capitulation event intraday. Look for a large volume spike with extremes in TICK and then a positive divergence in TICK vs the market such as TICK starts moving off extreme lows while the market hovers near them.

I find one of the easiest ways to do this is to draw parallel trend lines around TICK and price and watch for TICK to miss the bottom trendily or break above the channel while the market remains within it. Note TICK has hit an extreme reading of -1431 this morning.

Obviously we also want to watch for the capitulation event or flameout. This will typically occur on a bullish candle, it can be on any of the intraday timeframes, but the stronger the candle like a large hammer and the higher the volume at that candle, the more likely you've found an intraday capitulation point. As an example with just what we have so far today...

This 30 min SPY chart isn't the best looking hammer, but it does have a longer tail and large volume.

Look at TICK now since that has been put in and since the first TICK capture above...
Note TICK did not reach the lower trendily and is now moving above the channel.

Also just because we have an intraday flameout/capitulation event, it doesn't mean that's a reversal point just like with primary capitulations in a primary downtrend (bear market). Often a reversal process that is more lateral in nature will take place while short term 3C charts post positive divergences as the base is carved out that price will rally from.

I'd like to be out of VXX before that process gets too far down the road.

A.M. Update

It seems global we have had a bond sell-off from Japanese JGB's to German bunds and across Europe  with a certain conspiracy theory as to who is doing the selling which we'll wait for confirmation of conspiracy fact.

US Treasuries sold of as well, but as I posted yesterday, I think this is more destruction to build a base and I suspect we are nearly done.
The selling is across the curve, however this is the 30 year Treasury future intraday and it looks like it's looking for a bottom here.

See yesterday's Multiple Asset Update: Market, VXX, TLT for background or Friday's,  Bond Rally / Swing.

As bonds and Treasuries have been moving together as of recent, Index Futures fell... Again I suspect we are closer to a bottom and will be looking to close VXX calls shortly with some evidence.

 ES 1 min largely in line, I'll be ;looking for this to go positive and likely close the short term VXX call trade.

ES 5 min with a positive divergence like the other Index futures.

7 min with the same.

It seems we have found our "early in the week weakness". Now I'll be looking for the pivot as I still expect a bounce as posted in Friday's week ahead, but I suspect it won't happen instantly, but may require a small reversal process. I'll also be looking to see if there are trade opportunities worth the risk of being long here as selling /shorting in to price strength when it comes is the more sound strategy.

As for Oil, as posted in  USO/Oil Update yesterday,

"Here's what has happened recently in USO as I suspect a near term (as in a day or so) bounce off support/resistance of the base"

And that is already underway from the overnight session, we'll keep an eye on it for a tick down as I don't see it as much more than a bit of noise.
Oil Futures since yesterday's close.

Again, I'll likely be closing the VXX calls sometime today, perhaps early.

Monday, May 11, 2015

Daily Wrap

Today was interesting for a myriad of details, but not too far removed from the The Week Ahead forecast. Early weakness was not as weak as I expected, but then again I don't believe it is done.

The VXX Call position opened Friday after Taking Both VIX Puts off the Table and opening Trade Idea-EXCEPTIONALLY SPECULATIVE...VXX Short Term Calls, worked well and was well timed. The VIX call trade which was meant to be a very short term trade, essentially taking advantage of any weakness early in the week, actually ended up (with the May 22nd expiration rather than the intended May 15th expiration) closing at a gain of +.22% for the day. That is what the trade was essentially meant for, although I decided to leave it open as I believe we have more downside. See today's VXX / VIX Futures Update.

Interestingly the TLT long (call options or because I could not get calls, I used TBT short to create a 2x leveraged long TLT position) position from Thursday, Trade Idea: Long Bonds / TLT was put on at half size as a counter trend trade/swing+ trade as posted in Bond Rally / Swing as well as Friday's The Treasury Counter Trend Trade which said the same thing as both posts on Thursday...

"This tells us that a near term pullback is likely even though the position entered yesterday went green today. I left room specifically to add based on expectations we'd see a pullback as the chart above indicates."

So weakness in the market early in the week, VXX bouncing and TLT / Treasuries coming down to build out a wider base were all expected today and for the most part, were all exactly on target except I expect a bit more weakness from the market which we'll get in to below.

There's also the question of oil/USO which is getting to be interesting. Who knows what happens with Greece tomorrow.

 Despite what we saw as of last week and forecast, it "seemed" like stocks were holding up early on what "seemed" to be considered a rotational move from bonds to stocks or some trepidation waiting to see if that theme caught a toehold. As you can see small caps (yellow) and transports (salmon) were the best performers on the day, still the Russell 2000 only closed up +0.07% on the day. Everything else was down about half a percent.

Above we have 30 year yields in red intraday versus the SPX in green and just as 30 year yields which move opposite treasuries, broke 3% the market hit another leg down. So much for any rotation perceived or otherwise.

This is TLT in red as the bond market closes at 3 PM. Note how the SPX tries to bounce after the bond market closed, but new highs in yields (via futures) killed that move.

 Remember our treasury trade, rather countertrend trade. I only opened a half position as I suspected treasuries would come down to form a larger base before moving higher.

Shorts in treasuries are near their extreme range so there is a lot of fuel for a short squeeze and the perfect place for it.

 There's little doubt in my mind that treasuries continue lower on a primary trend basis as the 60 minute chart shows with 3C downside confirmation.

 However near-term, this 10 minute chart moves from in-line to a positive divergence and a wider base running additional stops today. This is along the lines of what was expected on Thursday and Friday, thus the half-size position which can be filled out.

 The five minute chart shows more detail and a stronger looking divergence in TLT (20+ year treasuries).

 And the two minute chart shows a change in trend as well.

Here's a closer look with a negative divergence on Friday as was suspected. I would wait until we have better short term chart confirmation of accumulation before entering the second half of TLT long/ calls. However, There was already evidence of that process beginning and across the entire yield curve.

 30 year treasury futures on a one minute chart intraday with a positive divergence as prices come down below Thursday's low, exactly what we would want to see when we suspect a base is being built.

This even migrated to the five minutes chart.

The five and 10 year treasury futures are also showing positive divergences intraday. I suspect we're going to see a nice countertrend short squeeze but I do not see this as a trend reversal.

As for the averages and my belief we will see more weakness…
 SPY 2 min leading negative

SPY 3 min leading negative

IWM 2 min leading negative

IWM 3 min leading negative, However as I've already made clear, I suspect we may see a bounce attempt but we will only know what the probabilities are once we see price come down some more and determine whether or not it is being accumulated short-term.

 The QQQ 10 minute chart would exemplify this bounce, with Price coming down forming a wider base than simply the "V" from last week.

Futures have something say as well...
 The five minute ES chart suggesting more downside near-term

The five minute TF chart suggesting the same.

Bounce or not it doesn't change the big picture...
 Four hour ES

Four hour TF/ Russell 2000 futures.

We may see a little bit of strength early in the morning, recall my comments regarding NFLX trade set up. This is based on some one minute charts.

SPY 1 min with a very minor positive divergence. The two and three minute charts above are the highest probability near-term, but this may be the start of accumulation into a move lower as I just mentioned above in determining probabilities of a market bounce or attempt.

As for oil...Timing wise this seems to make sense. The wall street journal reports that OPEC could consider production quotas at the June meeting. If oil/ USO make the move lower as I suspect and gather a head of steam, the June OPEC meeting could be the catalyst for USO to break out to stage 2.

Right now only Kuwait and Qatar can meet their budget at $76 a barrel oil according to the IMF, that means OPEC members can't afford prices this low much longer.

The Dominant price volume relationship today was in all of the averages except for the Russell 2000 and it was closed down / volume down, which I have nicknamed, "carry-on" as in keep doing what you're doing, meaning the market is likely to move down tomorrow as it did today as there are no short-term internal imbalances.

I'll check on the futures later to see if anything interesting is developing but as of now I don't have anything to add to what has already been published late last week and today. If I do see something in futures tonight, I will post it.

I think we'll have some nice opportunities over the next few days for both short-term leveraged trades and longer-term trending trade entries as well as seeing some current positions post gains like VXX.

Have a great night