Tuesday, May 26, 2015

Closing IWM June 19 $124 Puts For Now

Although these were meant as a longer term position, I don't see any great reason not to take the gains off the table and re-open the position at a slightly better area later.


Taking QQQ June 5th $111 Puts Off the Table For Now

I may come back to them, but being these are an earlier expiration meant for a shorter term move (June 5th), I think I'll take the gain as they look to like they are running out of intraday steam.

 The QQQ Tracking position in June 5th puts ($111) at a 60+% gain this morning...

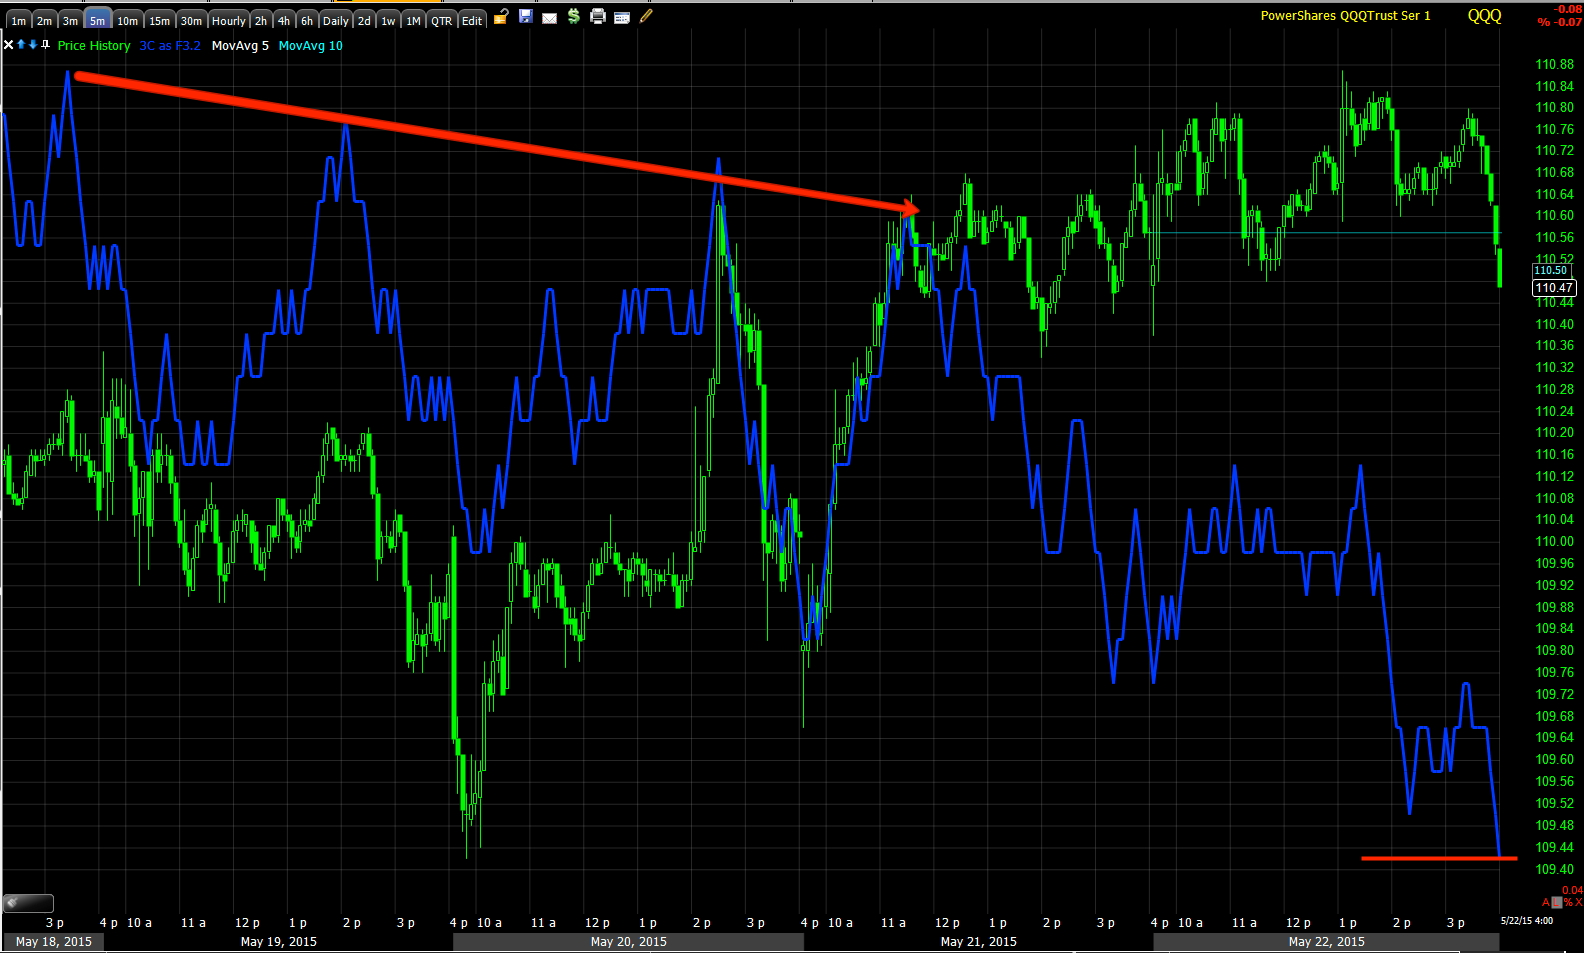
 The 5 min , stronger chart suggest more near term downside with the leading negative 5 min divergence (red).

However intraday the 2 min chart seems like it's looking for an intraday toe-hold and I'd prefer to take the gains and re-open the position on an intraday bounce.

Look for the intraday TICK downside extremes or channel break intraday and a volume spike in the Averages' on an intraday low that forms a bullish candle on one of the intraday timeframes on RISING volume-this will likely be the intraday capitulation low.

For now though, I see no reason not to take gains such as this off the table and look for a new entry.

A.M. Update

Since Friday's weekend forecast, the F_E_D's Fischer ( a voting soft dove) said there was an argument to be made for the path of F_E_D rate hikes or guidance, but the market will have to understand that the F_O_M_C is under no obligation to stick to them, which seems like common sense as well as seemingly redundant and meaningless to publish the path of rate hikes, apparently there seems to be a path judging by Fischer's statement which is the argument I've been making for about a year. Fischer added that rate hikes were "no big deal".

In addition the F_E_D's Mester (non-voter) says the time is near for rate hikes to begin and adds that the F_O_M_C will go in to the June meeting with an open mind and will be looking at the most recent data, suggesting in my view that as the minutes implied, there's a probability of no rate hike in June, it CERTAINLY isn't ruled out, that the "not ruling out a June rate hike" part may be more serious than otherwise initially taken (A September hike).

Spanish Elections on Sunday showed considerable progress for the Syria-like "anti-austerity" political groups, which of course is not being taken well by European markets.

In the US, after the 8:30 Durable Goods Order's beat with New Orders at -0.5 (better than consensus of -0.6) and "Ex-Transportation" at +.5 on consensus of +.4, it seems the real mover were the prior revisions with prior New Orders being revised up from +4 to +5.1% and "Ex-Transportation" being revised up from -0.2 to +0.6% sent the $USD higher continuing the counter trend bounce we expected as well as sending Stocks and Commodities lower including Crude as we have expected and specifically in to the new week as the 3C divergences ended the session Friday with considerable short term negative (in addition to longer term), suggesting stocks pick up where they left off at the close Friday as the new cash week opens this morning (even over a 3-day weekend).

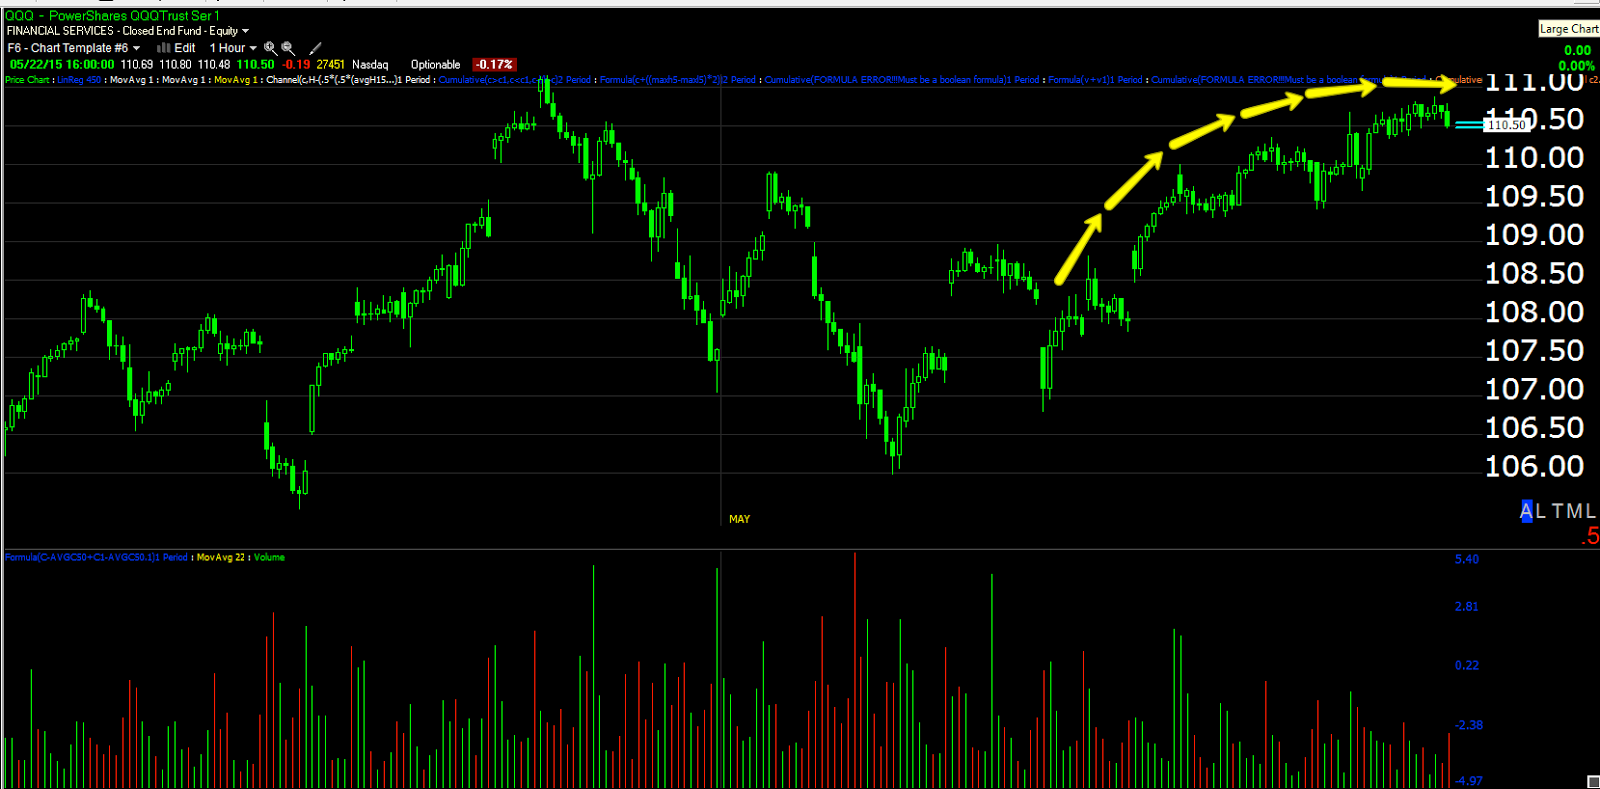
First we expected the Averages to move lower early in the week based on the Igloo/Chimney pattern with the "Igloo" part not complete as seen here in Friday's The Daily Wrap

"I think the new Call/Put positions listed above to be profitable astrally in the week as the QQQ "reversal process" Igloo price pattern above that was expected to form this week should see early weakness next week before a head fake/"Chimney" which should allow us to open the new positions I have been watching this week, although we didn't enter any of the watch list trades as the signals were "close", but not quite there."

Thus the QQQ and IWM puts are in the green this morning as the concept of 3C picking up where it left off played out once again...Also from Friday's The Daily Wrap with significant closing negative divergences posted in all of the averages in Friday's The Daily Wrap.

The overnight and this morning's ES chart (1 min) with an initial plunge at 8:30 on the Durable Goods data and a second plunge lower at the 9:30 open as expected in The Daily Wrap.

This morning's 3C charts of the averages as they pick up where they left off with Friday's closing weakness as well as finishing the "rounding / Igloo top" lower...
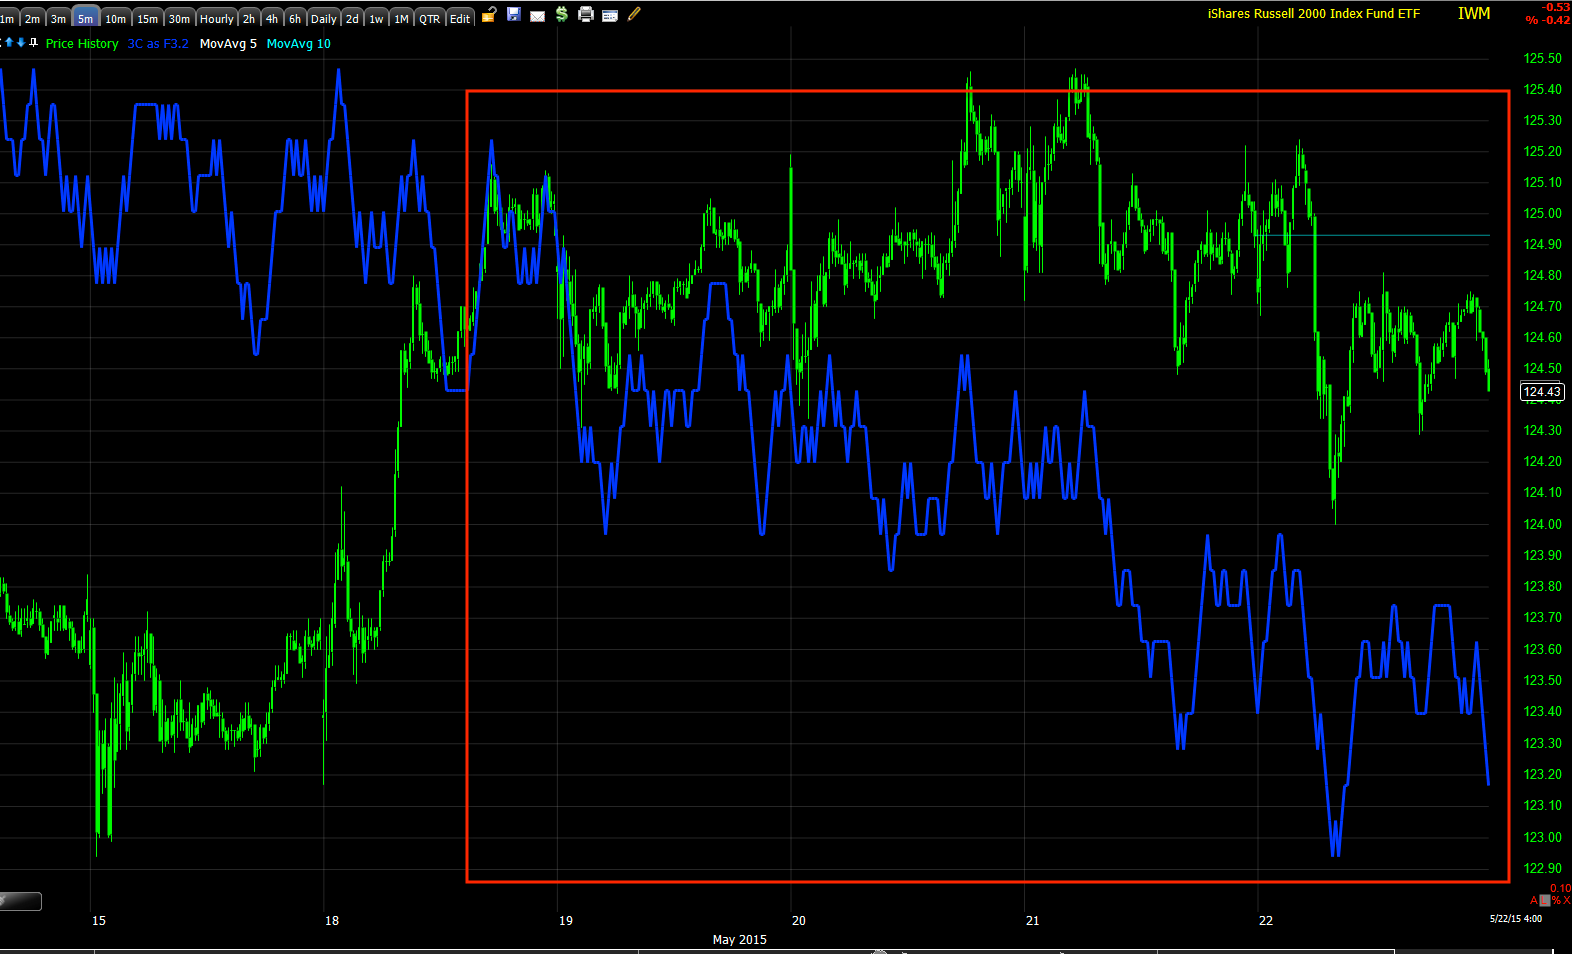
 IWM with Friday's leading negative divergence/distribution in to Friday's close with this morning's concept of "Picking up where we left off" sending the IWM lower.

 The QQQ also sent lower with Friday's 3C negative divergences at the close picking up where they left off.

FOR THE MOMENT, QQQ AND IWM PUTS WILL BE LEFT IN PLACE.

SPY 1 min intraday with Friday's closing negative divergence picking up where it left off sending the SPY lower this morning.

Also our VXX call seeing gains this morning as the VXX closing positive divergence on Friday picks up where it left off , sending VXX higher this morning...
VXX 2 min with a leading positive divergence in to Friday's close.

As mentioned above, the $USDX continued its counter trend bounce for now higher on the Durable Goods print, also as expected, although we may be nearing a top for the counter trend bounce...
 $USDX moving higher this morning (1 min chart) on  not only a 3C positive divergence BEFORE the Durable Goods print, suggesting once again that we are seeing more leaked data as we did last week, but also continuing the counter trend bounce we had expected and have seen in the $USDX's trend...

60 min $USDX with the down trend and the "Counter trend" bounce at the yellow arrow. Remember, to be effective, counter trend bounces have to be strong and this is the reason we have seen such a strong $USD bounce with the $USD posting the strongest weekly move last week since 2008!

As might be expected, the move lower near term we have expected in oil has continued this morning on the Durable Goods data and $USD print higher...
 Crude Futures (1 min) lower this morning on the Durable Goods print and $USD move higher.


Moving oil (USO) lower as our swing term expectations suggest before a possible rend reversal after oil finishes up building its longer term base. This morning's move in red to the far right.

TLT/Bonds have moved higher which is in line with our longer term partial long position for a counter trend bounce in TLT/Treasuries, however not giving the near term pullback I had hoped to see to add to the position, at least not yet. I'll update TLT later.

Gold has moved lower with pour swing trend expectations lower, however the near term bounce expectations have not been met, however I will look at Gold and update as necessary if there looks to be a bounce coming...
GLD with its 1 min negative divergence lower on Friday afternoon suggesting a cash open lower as the 3C divergence picks up where it left off.

I'm going to get back to the charts as I suspect we may need to do some short term position management shortly.


Friday, May 22, 2015

The Daily Wrap

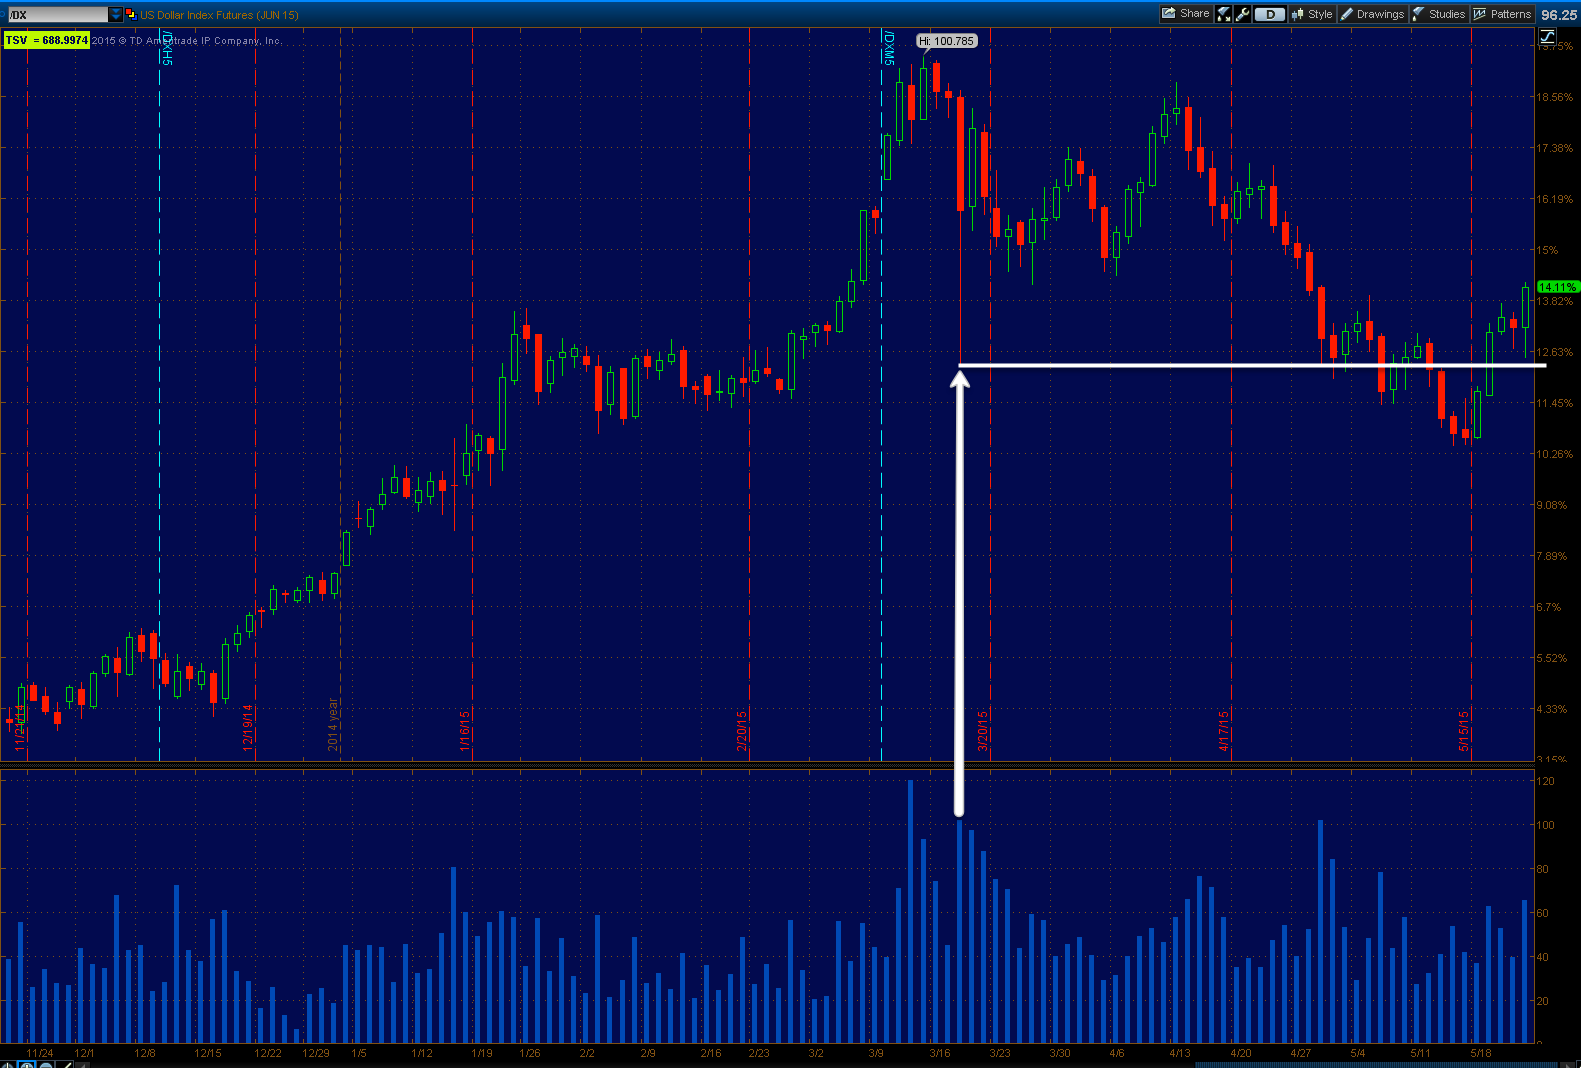
We have been looking for a counter trend bounce/rally in the $USD as the daily trend had made a lower high and a lower closing and intraday low. Despite a year+ of carry trade based $USD rally, it wasn't until the counter trend rally this week that we not only saw the biggest 2-day move since October of 2011, but on the week, we saw the biggest move on the week since 2008! This is the nature and a great example of the strength of a counter trend move as we see the biggest 2-day and 1-week gain in approx. 3.5 and 7 years respectively (+3% weekly $USD gain) during a bear market decline.

Much like the counter trend move we have been expecting in 30 year Treasuries which are also in a downtrend/bear market, we have an excellent example of how strong these bounces/rallies are-this not during a bull market uptrend, but a bear market downtrend. As I said several times before and earlier today, because it is a counter trend move, it needs to be convincing and thus these counter trend rallies are some of the strongest rallies/bounces you'll see, even (or especially) in a bear trend!

 The 1-day $USDX chart after a lower high and lower low (both closing ad intraday) are made.

We waited for the intraday low (white trendiline) TO BE TAKEN OUT AS THAT WOULD HELP MOMENTUM WITH A SHORT SQUEEZE AS NEW SHORTS ENTER ON THE BREAK BELOW CLOSING AND INTRADAY LOWS (above).
                                                                                              
The weekly $USD chart posted the best weekly gain since 2008 as the concept of the counter-trend rally plays out with new shorts who recently entered on price/support break provide extra momentum on a short squeeze. This is why counter trend bounces/rallies are so much stronger than bull market moves (see the TLT / 30 year Treasury futures updates).

This morning CPI data came in hotter than expected with gold's initial move lower on $USD (F_E_D Hawkish tone) strength. However the $GLD/gold futures positive divergences are in place on inflation expectations starting to run hotter (Gold is typically bought on inflation expectations as a hedge to inflation).

 $USDX 1 min today with accumulation from 2 a.m. EDT in $USD futures until 8:30 a.m. when the CPI data was released and printed hotter than expected due to none other than Obamacare (Health Insurance costs rising rather than declining as Obamacare promised) solely responsible for the hotter than expected inflationary pressures.  * On a personal note, my health insurance with a provider I've been with for 11 years has nearly doubled over the last 1 year to the point in which my healthcare costs are my biggest monthly expense even above housing!

The 3C accumulation/positive divergence suggests (as do numerous other assets) that the CPI print was leaked at least 1-day in advance!

Gold's initial reaction (as well as stocks, Treasuries, Crude, most commodities and equities) declined on the stronger $USD which was reflecting a more hawkish tone toward rate hikes as inflationary pressures are one of the main things the F_E_D is looking for to begin rate hikes.

As for gold futures, we started seeing this yesterday (another sign that the CPI data was leaked a day in advance) , POSITIVE DIVERGENCES suggesting the upside we had expected yesterday on a weaker $USD was coming today. However it was not on a weaker $USD, which means gold was reflecting more positive inflationary pressures as gold is bought on inflation expectations as a hedge to inflationary pressures.
 The 5 min Gold Futures positive divergence...

 YG/Gold futures 7 min chart positive divergences after recent negative divergences earlier in the week.

YG/Gold futures 15 min chart with negative divergences sending gold futures lower followed by the positive divergences seen yesterday,

And 60 min YG/Gold futures with a CLEAR negative divergence followed by positive 3C divergences/accumulation with #1 yesterday reflecting our closure of GLD June put positions yesterday, Taking GLD June 19th $117 Put Off the Table at a +15% gain and #2, yesterday's Trade Idea-SPECULATIVE GLD Long GLD June $115 call position opened 30 minutes later which closed at a +16% gain by the end of the day.

Obviously we are expecting near term gold appreciation making our closure of the Put position near the exact intraday lows as well as our Call position entered near the intraday lows yesterday. WE SHOULD SEE GAINS IN TO OUR CURRENT OPEN GLD CALL POSITION EARLY IN TO NEXT WEEK.

The early weakness on the hotter than expected 8:30 a.m. CPI print sent Equities (as mentioned above) lower in to an op-ex Friday in which the max-pain pin is usually close to Thursday's close.
 Most of the averages bottomed out for the day right at the European close intraday today with Transports once again leading the way lower.

As last Friday's (May 15th) The Week Ahead forecast indicated:

"I don't think the bounce is quite complete or its reversal process is not quite complete which means that my first assumption would be that the market would be rangebound and choppy in the area finishing the reversal process"
The forecast was amazingly right on as the major averages chopped about in a lateral range all week as can be seen above with our Core Short Position, Transports (salmon) leading the averages lower on the week.

See today's The Week Ahead for expectations/forecast for next week. There are numerous indications that suggest the forecast for next week and beyond is right on, allowing us to enter numerous position which we did not have solid signals for this week and good thing as the week was flat.

Our newer positions opened this week and very recently including Thursday's Trade Idea IWM Short/Puts  & Trade Idea: SPECULATIVE QQQ Puts as well as Wednesday's Trade Idea: VXX should all do well in to early next week...

Although I do expect a "Chimney" as part of the head fake in the "Igloo with Chimney" price pattern to play out...

I think the new Call/Put positions listed above to be profitable astrally in the week as the QQQ "reversal process" Igloo price pattern above that was expected to form this week should see early weakness next week before a head fake/"Chimney" which should allow us to open the new positions I have been watching this week, although we didn't enter any of the watch list trades as the signals were "close", but not quite there.

The concept of 3C charts picking up where they left off in the cash market even over a weekend or even a long holiday weekend, should see the positions entered this week at a gain early next week as today's closing 3C charts/signals are all reflecting early weakness which would be in line with the "igloo" price pattern finishing before the head fake Chimney which "should" allow us to take gains on the new options positions as well as enter new, longer term positions on the head fake move right after booking gains on the new positions above on early week weakness.

Here are examples of how the 3C charts finished today and what that means for the market early in to next week which is in line with our current positions opened this week (from above)...

QQQ signals for early next week... "Picking up where the 3C signals left off"
 The QQQ intraday 2 min left off at the close with a deep leading negative divergence suggesting early weakness next week, as well as profitable put positions in QQQ.

5 min QQQ 3C leading negative divergence also suggesting profitable QQQ put positions entered this week...

SPY...
 SPY intraday 3C divergence closed with a new leading negative divergence in line with what we see on the Q's above.

5 min QQQ leading negative divergence at a new low just like the QQQ.

IWM...
 IWM 2 min intraday closing at a new leading negative 3C divergence/distribution suggesting profitable put positions in IWM as well early in to next week...

And the 5 min IWM 3C leading negative like SPY and QQQ with good confirmation.

VXX
VXX intraday 3C closed the day with a new leading positive divergence suggesting early strength in VXX which trades opposite the market so we have confirmation (multiple asset confirmation) with the VXX 3C chart above and should see early gains in VXX calls just entered this week with last week's call positions closed at gains of +56%, VXX Call P/L

 VIX Futures 1 min chart also showing a leading positive 3C divergence, (multiple timeframe and multiple asset confirmation) suggesting early gains in new VXX positions early next week.

 And after a head fake move, our longer term 10-15 min VXX charts are pointing to new positions that we should be able to open next week (short) on a head fake move, at gains and moving in the right directions this longer term 3C trend divergence pointing to lower prices after the head fake move.

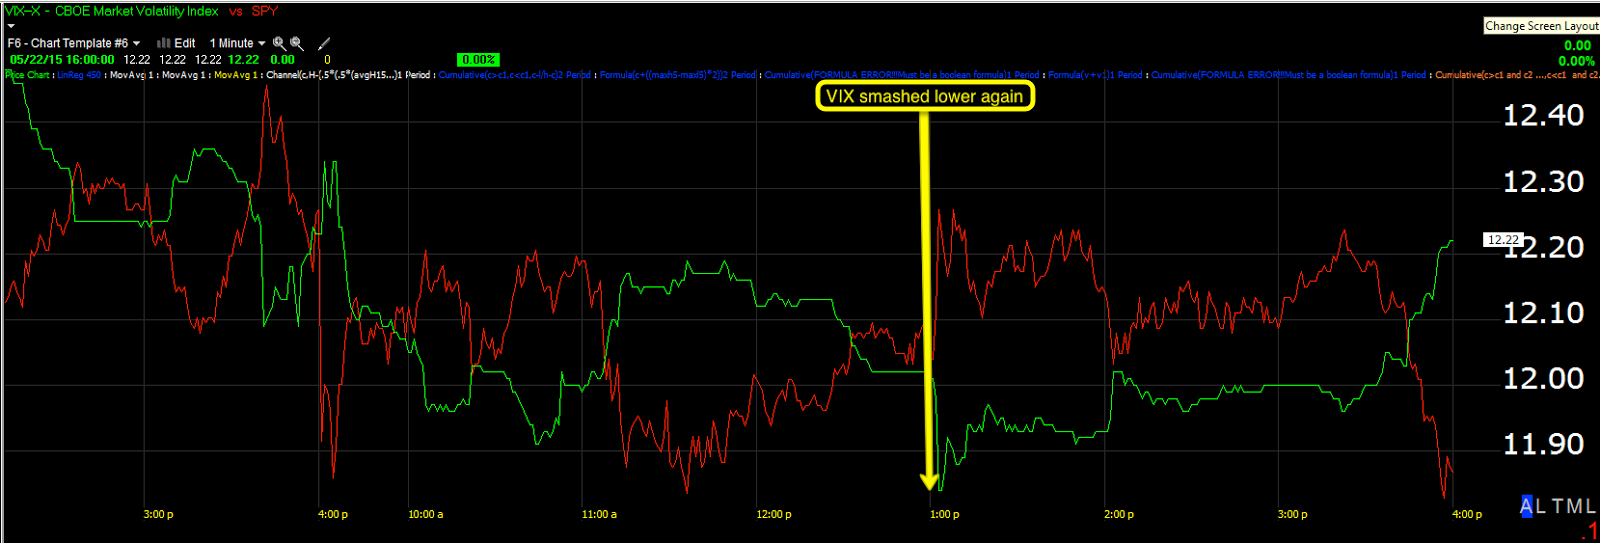
Speaking of VIX, did you notice that once again today it was SMASHED lower?
 VIX (green) vs SPY (red) smashed lower intraday to lows not seen all 2015.

The Daily VIX, confirming the charts above for price action early next week show a bullish Harami/inside day candlestick pair as well as a bullish "Hammer" (bullish upside reversal) today as well (two bullish upside reversal in VIX-pointing to lower prices in the market early next week as shown above in the 3C charts of SPY, QQQ and IWM).

This means the QQQ/IWM Puts should be at a nice gain as well as the VXX calls before a head fake move allowing us to enter new positions which should fail as the VXX (short term VIX futures) above show 10-15 min longer term charts also pointing to upside (market downside).

We have numerous Index Futures confirming as well, this is just a small sampling...
 TF/Russell 2000 futures 5 min chart with a positive divergence which I interpret to be a head fake move after the Igloo top is in place and we take gains on QQQ/IWM puts and VXX calls. We should be able to enter watch list shorts at this time and longer trending VXX long positions.


  60 min ES/SPX Futures reflects the 3rd trend or "What comes next" from our Week Ahead forecast from last Friday,

60 min TF shows the same, this would be a reflection of the trend after initial market weakness earlier in the week followed by the probability of a head fake move where new longer term positions are entered and then the downtrend in the market reflected by this 60 min chart.

Remember the expected trend in $USDX, which should be in line with the 60 kin charts above and also reflect the continuation of the $USDX downtrend and the end of the counter trend bounce we are currently in the middle of.

This would also reflect the continuation of the carry trade unwind so it would not be surprising to see increased downside momentum as the $USDX returns to its primary trend...

This is the 1-day $USDX chart and the expected counter trend bounce this week which is the strongest weekly move since 2008 with EUR/USD seeing the worst week since 2008 (-4% lower Euro this week). However by this time we should see the counter trend bounce end and the $USDX making a new lower low on the daily chart/primary trend which would mean the Carry Trade unwind will have taken on more momentum and $USD/JPY should trend lower while the Yen heads higher. I fully expect Treasuries to continue their new primary downtrend as well and commodities heading higher.

I'll have crude updates early next week as well as gold and the averages.

Otherwise, the indications in today's The Week Ahead should be accurate.

As for Internals, they are mixed with Close Down/Volume Down which is the least influential and the Dow with Close Down/Volume up with 17 stocks, a 1-day oversold condition, although not confirmed by the other averages.

Sector performance would tend to agree with the Dow's Dominant P/V relationship with 8 of 9 sectors in the red, a short term oversold condition with only Financials green at a mere +0.04% and the laggard being Industrials at -0.45%. A 1-day oversold condition, but not that strong.

Of the Morningstar groups, also flashing a 1-day oversold condition with only 71 of 238 groups closing green.

Once again, just eye-balling the SKEW Index, while not in red-flag territory, the upside rate of change is increasing and I'd expect SKEW to be pushing red flag territory next week.

Otherwise the Futures indications aren't as important on an intraday basis, it's the 3C charts closing sentiment which I have covered above.

We have tons of items on our trade watch list and I expect sometime toward the middle or later next week we'll be throwing out new Trade Ideas and set-ups as the initial weakness allows us to take gains on current short term option positions and enter longer term trend positions as the $USDX's counter trend rally comes to an end and the carry trade unwind continues with the $USDX's primary trend lower.

Any additional information I have to add I'll do so over the weekend. Other than that, I am wishing you a very peaceful and happy weekend with the longer Holiday weekend and Monday closed for Memorial Day.

Have a GREAT WEEKEND!


The Week Ahead

The charts are not simple in this area.

It looks like Gold will move higher, but whether this is a temporary bounce as we initially saw before a wider pullback is now up in the air as gold now seems to be discounting inflation expectations which could continue sending it higher.

I haven't changed the forecast for crude, a pullback followed by a stronger move up.

One of the things that seems to stand out the most is the Igloo/Chimney top and reversal process.

We have the Igloo top in place, the last head fake move or Chimney looks like it will take place next week, beyond that everything starts turning very negative. My interpretation is that we will get a head fake move, this is where we should have good entries in assets we have been waiting on for signals like NFLX , perhaps transports, Financials almost for sure.

It seems to me that soon after the $USD counter trend bounce may start to fail. While there are some positive Euro signals that would naturally come with a $USD decline, the strongest currency signals are for the Yen to strengthen, meaning the USD/JPY declining, this is the clearest signal I have seen that the carry trade unwind that the bouncing dollar has fascilliateated at smaller or no losses should being to unravel again and that makes sense as the head fake chimney move in the market/equities would be in the exact right place for the start of a $USD decline from the counter trend bounce and the selling of carry assets like stocks and bonds. It still looks like bonds will see a pullback and I'm still thinking a counter trend bounce, but these need to be watched carefully as it seems difficult to pull off a counter trend bounce if the carry trade unwind starts to resume later in the week.

Therefore I'm looking for the chimney on the igloo tops I showed in the last post, that's also the entries for numerous trades we have been patiently waiting for to set up. I think the switch from a head fake bounce in equities to a sharp decline will be a very fast one so I wouldn't expect the same lazy market we have sen this week.

I'll add more color after the close.

Market Update-2 PM Post Pin Edition

Well if you had ANY doubts about the beliefs we have held here at Wolf on Wall Street with regard to F_E_D policy tightening, this week's news and data should put that to rest.

Our views that the F_E_D had long ago started to lay the ground work for an exit from unprecednted acomodative policy started the same day QE3 was launched ironically. Accommodative policy has led to unprecedented market gains that are during a period of unprecedented economic weakness, disguised using smoke and mirrors, accounting gimmicks, stock buy backs and insane financial reporting standards that would shock China. All of this meaning that the F_E_D has built not only a sand castle within the stock market, but a virtual Sky-scraper out of sand.

By all logic, as they CONTINUE (as accommodative policy has already been tightened with the ending of QE 3 which had no ending date unlike previous QE-forrays) to unwind this monstrosity of an economic experiment that had its roots in the "Roaring 20's" which Ben Bernanke was an ardent student of the period, we should see equally as distorted declines to the downside, much like the end of the Roaring 20's was capped off with the 1929 crash and Great Depression.

As mentioned, Bernanke was an ardent student of a new F_E_D policy as led by the NY F_E_D's Benjamin Strong and his "New Idea" that the economy could be managed via F_E_D asset purchases, the fore-runner to QE. There's little reason to expect anything less than the same effects that were a result of assets purchases through the 1920's that seemed to produce a robust economy, but ended badly.

Benjamin Strong who led the asset purchases that Bernanke is so fond of, actually died in 1928, never seeing the end results of his disastrous policies which culminated with the 1929 crash and Great Depression. Since modern QE has taken Strong's ideas to a whole new level and have shown no progress at all in fixing the economy here in the US or anywhere across the globe where it has been employed (if it had, we would not have needed QE 2, Operation Twist, Twist lite or QE 3), there's no logical reason to believe that the end results will be any better than those of the 1920's F_E_D policies. In fact, at least in the 1920's the economy actually improved for a time before the whole myth came tumbling down. How much worse should we expect this time as the monetary experiment has lasted longer and has been brought to never before seen heights in a world that is more economically connected than ever before. It's like a spider web in which the US Sub-Prime scandal led to the periphery of Europe going down the tubes and needing multiple bailouts until the core itself was sick. It crossed the sea to China in which the great Dragon's advancer has stalled out.  "The Butterfly Effect" is stronger now than it ever was.

If the Minutes didn't convince you  that the F_E_D is on a pre-determined heading as they seem to be more worried about what will happen if they don't hike rates than if they do, then the immediate response to make F_E_D arguments F_E_D fact within hours should convince you. Not only is the BEA taking the F_E_D's "transitory weakness" to all new levels by legitimizing it and carrying out seasonal adjustments of seasonal adjustments until they reach the correct goal-seeker number that allows the F_E_D to hike without having to explain why, additionally Goldman Sachs immediately re-ran the US Economic FRB model to suggest "Little Slack" in the economy, a Yellen Catch-phrase , all within hours of the release of the minutes. If the BEA, the San Fran F_E_D and Goldman all seeking to turn "transitory weakness" in to GDP -calculating errors doesn't raise red flags about the sincerity of all of these efforts, perhaps today's disclosure that the US Department of Commerce has joined the fray and will also Double Adjust the economic data in what is now being given a name and a face,  RESIDUAL SEASONALITY .

THIS CONCEPT WILL TAKE THE F_E_D'S DEFENSE OF WEAK Q1 DATA AS BEING TRANSITORY AND TURN IT IN TO AN ARTIFACT OR ERROR IN THE CALCULATIONS TO SUGGEST NOT ONLY WAS IT NOT MEANINGLESS TRANSITORY WEAKNESS, BUT IN FACT RATHER SOME MISTAKE IN CALCULATING THE ONLY THE FIRST QUARTER GDP AS TO REMOVE THE ROAD-BLOCK TO THE F_E_D HIKING RATES BY CALLING Q1 CALCULATIONS A MISTAKE.

So far from Yellen's speech today, I haven't seen anything to contradict anything above.

As to the market as the op-ex pin usually ends by now... Weakness. Our expectations for this week's market action from the The Week Ahead post of last Friday:

"I feel that we'll definitely be moving toward the 3rd trend forecast from last week, the one that comes AFTER the bounce.

I don't think the bounce is quite complete or its reversal process is not quite complete which means that my first assumption would be that the market would be rangebound and choppy in the area finishing the reversal process, but we also have some very easily recognizable resistance areas that are a hot bed for a head fake move, I have not doubt any head fake move or false breakout would be exactly that."

The two expectations that are near diametrically opposed  one based on a strong concept, the other based on the charts, were both correct in a way I could never have imagined last Friday as I posted both ideas-both of which were 100% accurate...

 The daily SPX chart and so far, the "head fake" move above the clear ascending triangle / resistance of nearly 3 months. One of two seemingly contradictory expectations for this week fulfilled- not strongly as is usually the case, but fulfilled in having broken above nearly 3 months of clean, clear resistance which would "seem" to make the "Reversal process" expectations for this week impossible; the choppy , lateral trade. However...

The 60 min SPX chart for this week is as close as you can possibly get to the "Week Ahead " forecast from last Friday with a choppy, lateral range through the entire week!

Below the trend through all of the averages has been the reversal process or a trend of continued weakening in the averages' charts...
QQQ...
 1 min shows a worse 3C position today

When we look at the start of the cycle, again May 6th and 7th come up time after time in different averages, assets, stocks, currencies, treasuries, indicators and more we see the 3C trend weaken systematically through the reversal process which can be seen as a large rounding top area.

Typically we'd look for the last head fake or the "Igloo/Chimney" price pattern with the rounding top which you'll see more of below and a chimney that is the last head fake move above the rounding top that serves as the best price based indication of an impending trend reversal or in this case, a DECLINE.

QQQ 2 min with some in line status, but an overall weaker position today as this has been the trend through the week.

QQQ 3 min showing the same continued weakening

As well as QQQ 5 min

IWM 1 min with weakness earlier in the day and in line since.

IWM 2 min chart with more weakness through today

The 3 min IWM chart since May 6/7th and weakening through the trend.

IWM 5 min trend from May 6/7th start.

IWM 10 min showing the rounding reversal process talked about last Friday and a weakening 3C chart.

SPY 1 min weakening further today

As well as the 2 min chart through this entire week, just as forecast in the reversal process playing out this week.

The 3 min trend showing the same through the entire week.

And the 5 min trend as well through the week

The 10 min SPY and this week's reversal process (yellow) with the "Igloo reversal process top" and a deepening 10 min leading negative divergence. I still would like to see 3C make a new leading negative low as I have drawn in on the 10 min chart in red.

I'll have the Week Ahead post out shortly.