As I look around at a lot of different charts today I notice a few things, there's some strength in price in certain risk assets, particularly some of our leading indicators, but look at the underlying trade and the impression of strength quickly gives way.
Then we have some underlying trade in some short timeframes of the major averages that show mixed underlying strength, Equity Index Futures like the S&P and Dow Futures show short term (5 min chart) strength in underlying trade, but the longer timeframes are in bad shape with no improvement.
First I'll show you the charts and then give you my initial impressions, underlying trade tomorrow, whichever way the market moves, should provide a more definitive answer
IF my theory or initial thoughts haven't already played out first.
The charts starting with some leading indicators...
This is High Yield Credit vs the SPX on a 1 min chart, HY Credit diverges from the SPX and it gives a signal just as it did on the 30th and the 3rd the SPX dropped. HY credit went positive today, it also had a very sharp, very fast move to the upside near the end of the day, this is suggesting a move higher in the SPX and probably very soon. Still I'm struck by how quickly, parabolically HY credit moved at the end of the day, it gives me a feeling of a thin market without much beef behind it to support higher prices for very long.
JUNK credit also put in a positive divergence today, this would also point to the SPX moving higher and likely tomorrow, however note that JUNK credit didn't approach the highs from late last week (red lines).
High Yield Corporate Credit also put in a positive divergence today, all 3 forms of credit point to a move higher in the SPX/market , note though how HY Corp credit did surpass last Friday's highs and then backed off at the close.
Because HYG is fluid enough, we can use 3C on it.
Here's the HYG 5 min chart it's in line as credit move up, but over the last several days HYG is seeing distribution, it looks like HYG is set for a move higher, but also set for a fast exit upon lower prices.
Here's the 5 min chart today specifically, we see some past divergences that worked out perfectly, today's 3C indication is distribution so not only longer term, but shorter term as well. Again, it appears HYG longs are set for a quick exit if need be.
Yields are like a magnet for the SPX, yields are negative and suggest that over a longer term period (defining a longer period as perhaps as short as 2 days or even less).
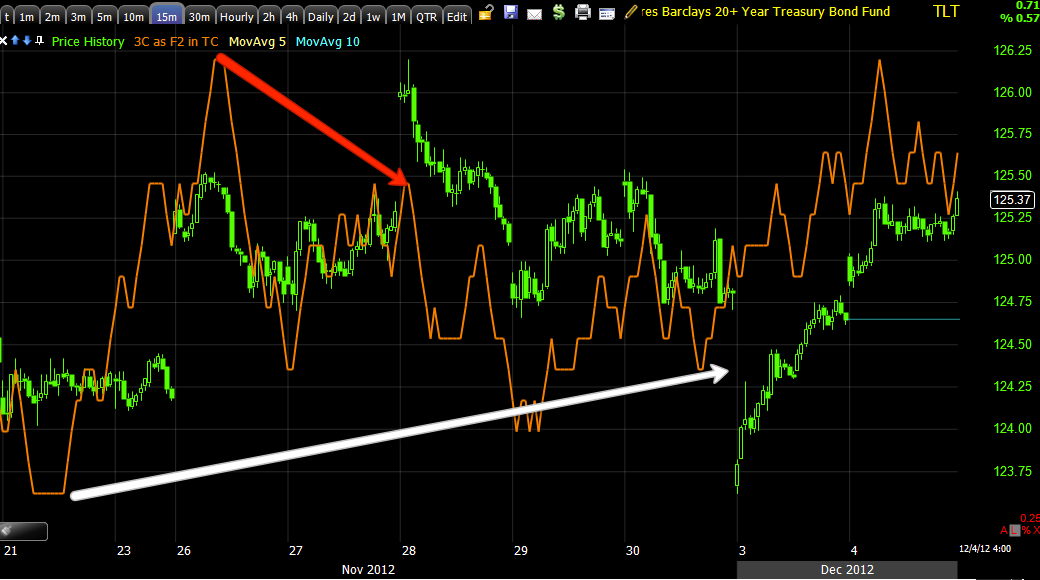
TLT-Treasuries have been seeing safe haven flows as the market has been moving lower the last couple of days-think about that 20+ point decline in ES over 1 day (that's huge).RSI with ROC applied (red) seems to be supportive of TLT.
The longer term 15 min chart of TLT also looks supportive, this would indicate that on a longer term, longer than the 1 day or so of upside credit is hinting at, TLT is strong which suggests there has been a flight to safety already set up, the players are already in place anticipating a move down in the market. I know this is getting a bit confusing with credit indicating what I believe will be a short lived move up in the market and Treasuries indicating a move down in the market as soon as the credit implied market bounce is over (again I'm thinking this could be a day or maybe even less-of course this is still a best guess until we have more supportive data).
TLT shorter term on a 5 min chart, say similar to the ES 5 min chart (the two are exactly opposite, which in this case means confirmation as ES is positive on the 5 min-"risk on" and Treasuries are negative recently on the 5 min "risk on" both confirm each other).
A quick look at a market average-the SPY...
The 5 min SPY chart is positive in to a decline off Monday's gap up opening highs, again, like credit and Treasuries, all suggesting a near term move up for the market-this is what I was seeing and why I wanted to lower any exposure to leveraged short positions in the very near term.
The SPY 3 min chart, again a very short term chart, has put in a strong leading positive divergence, but it does not have time on its side. In other words, the SPY looks like it's preparing for a sharp move higher, but since there isn't a large accumulation base (only about 4 hours) any such move would have a hard time sustaining itself for more than a day or so.
The long term chart of the SPY with the highest probabilities and able to sustain a longer move can be found on several timeframes shorter than this, but this 30 min leading negative divergence points to the size, duration and intensity of a move lower this chart could support.
Now pulling it all together, the SPX and NDX Futures...
The 5 min ES (SPX) Futures show a nice positive divergence, still it's only about a day long.
The 60 min ES trend was positive at first and moved the market higher, since then though we have a leading negative divergence, just like the SPY longer term charts, again able to support a large, stronger move lower.
The 5 min NASDAQ Futures show a positive divergence as well in to the lows today, most of the real leading was done this afternoon, in other words it's a strong positive divergence in intensity, but not in duration.
The duration comes in on the NASDAQ 60 min leading negative divergence.
Putting this all together (and remember this is just a theory, but if we get confirmation tomorrow you will understand it without a long explanation and be able to act on it), intense moves typically start with intense reversals, for instance a large trend higher starts with a large and intense head fake move, the same for a trend down, it starts with an intense head fake move usually to new highs or some important area before reversing.
What if the market were to show a lot of strength either most of tomorrow or for a day or so and then have the rug pulled out from under it sending us down on a longer, more intense short term trend? We would likely see the negative divergences in to the move up very early, giving us a chance to position ourselves before the reversal.
All of the charts above support this theory, or course it's not the only theory that could be supported, but it does work in this instance. This could set up some great positions while everyone else is being pulled in to a bull trap.
One more thing that we might consider, the F_E_D's POMO operations, tomorrow they are set to purchase 4.25 - 5.25 billion in longer dated treasuries, these will likely come from Wall Street banks who can quickly deploy the capital as we have seen in the past. However the NY FED is conducting another operation two days later, but this time they'll be doing the opposite and selling $7-$8 billion in short duration treasuries.
I'm not sure if this has anything to do with it, but as of tomorrow it is possible the banks could deploy several billion dollars in the market and 2 days later have to pull quite a bit more out, this could be the catalyst for an initial move up followed by a larger move down.
Again, this is theoretical, but the charts do support many of the assumptions laid out. Once more, if this is the case, we should see distribution in to strength fairly quick while the market moves higher allowing us to set up trades well before the market reverses.
I'll keep you updated on any changes in the overnight futures that may change the scenario.


No comments:
Post a Comment