OK, here are the charts mentioned, I included the Treasury Futures for 5, 10 and 30 years as well so you can see it's a trend through the Treasury complex, but the shorter term 5 year and the benchmark 10 year look a tiny bit different than the 30 year.
Also the TLT charts which is a position I'm still interested in as a long term, Trend long position and the chart below will show you why. I'm interested in the position around the $102 level, for leverage I may try to do something like short TBT to get what would effectively be a 2x long TLT position. The chart below will also show you why $102-ish is the level I'm interested in and that there's still a good probability that we can get in to that position
, the allure of which is that it looks to have a large enough base to be a long term or primary trend, trending trade, MY FAVORITE KIND!
This is TLT's 4 hour chart, a VERY strong underlying trend and it's clear where the base was organized, at the $102 level. The most recent signal is a negative, but not a horrible leading negative and for the size of the base, it could support more upside. This $102 level pullback is something I've been interested i a looking for for sometime now, it's not anything new.
As for an even longer, stronger trend...
TLT's daily chart shows a lot of "in line" or confirmation of the price trend, I suppose this had something to do with the F_E_D interference in the T market, but interestingly the base from late 2013 is the largest base on the chart and this with QE on its way out and/or at a time when the market knew QE's days were numbered (that was clear by the summer 0f 2013 F_O_M_C meetings).
The daily chart shows NO negative divegrence even for a rather decent size pullback if the $102 level were to be visited again.
Of course I'll monitor the developments, it's high on the watchlist, but I'm not married to the idea and if anything changes then I'll revise my outlook.
30 Year Treasury Futures...
This is the 5 min chart, despite intraday action mentioned earlier in which it looks like TLT will gain a bit and TBT drop a bitt, the 5 min chart which is stronger than the intraday action suggests a bigger pullback is going to be the dominant theme in the very near future.
The stronger 15 min chart agrees.
The 30 min chart which has had excellent signals also shows a fairly important negative divegrence for 30 year Treasury futures (the equivalent in equities would be TLT-20+ year)
And even the 60 min chart has a negative divegrence after being largely in line with a smaller negative causing a pullback and a smaller positive after that sending TLT to highs.
10 year (benchmark) Treasury Futures...
I don't have to capture many charts because they are all the same as TLT except there's some difference in the look of the 30 min and then the 60 min, the end result though is the 30 min is still in a negative divergence.
It's the 60 min chart that for this leg anyway, is still in line and not showing =a current negative divegrence like the 30 year above, however there is a large relative negative divegrence you can see by comparing where price and 3C were at point "A" vs point "B", lower at point "B" , but this isn't a smoking gun as far as negative signals go.
5 Year Treasury Futures
Again I don't have to capture many charts because they look the same as TLT until once again you reach the 30 and 60 min. The 30 min's end result is still a negative, but a relative negative so it's not as strong as the 30 year's divergence in the same timeframe.
The 60 min 5 year T. Futures are almost exactly the same as the 10 year, they don't have a noticeable negative divegrence right now on the current leg, but they do have a relative negative divegrence, both the 5 and 10 year's 60 min charts are weaker divergences than the 30 year (or TLT's equivalent).
TLT- 20 + year Treasury Bond Fund
This is the intraday 1 min that I mentioned in thinking we'd see some upside intraday, there's been a little pullback forming what looks like a small "W", I'm waiting to see how that resolves, it did not destroy this divegrence above, but it weakened it a little, however a pullback often strengthens them as the target accumulation area is reached.
The TLT 2 min intraday leading positive, the same I said about about the 1 min divegrence applies to this one as well.
The 3 min TLT looked a bit negative, but now is starting to look like that the "W" base or slightly larger intraday base (on the pullback) is a probability, here's the updated 3 min chart I am recapturing to update it's position.
This is a very different signal than the previous or earlier capture above, this suggests the intraday base that looked like it would send TLT higher intraday and TBT lower is actually widening its footprint which would allow for a larger move and a better entry / add to for the TBT long trading position.
The 10 min chart is a different trend entirely, not intraday and it has a leading negative right now after what has been fairly in line trend confirmation.
I didn't capture the 15 min chart because there was nothing of interest, but it is now starting to form the same type on leading negative divegrence as we see above.
And the 30 min TLT chart with a large relative negative divegrence, although it's the weaker form of divegrence, those dates below are days, not hours so its size is what is impressive.
And I didn't think I needed to draw on the 60 min chart to illustrate the 60 min leading negative divegrence, so these are now connecting up with the 4 hour chart's negative I showed earlier, it was there and waiting for these other timeframes to join it which it looks like they are doing.
TBT, UltraShort 20+ year Treasuries...2x leverage)
This is the long I have established at half size as a trading position now, the 60 min chart's positive divegrence confirms TLT's 60 min chart negative divegrence as these two move inversely or opposite each other.
From my perspective the idea is TLT pulls back possibly offering the $102 long term (long) entry I'd like to have, but in the course of doing so, TBT should make money as it moves up as TLT moves down.
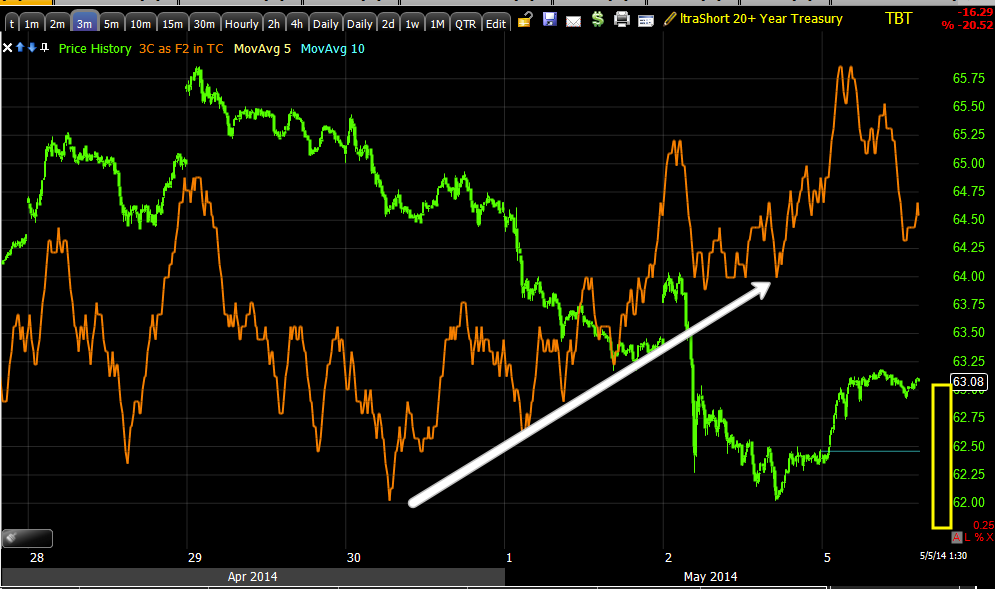
Sorry to skip around, but the 10 min chart has the yellow trendline where a probable stop run occurred, the divergence here looks like any stops hit (which become supply on the cheap) have been under accumulation. Furthermore, as a long position the head fake is usually a very good timing signal for a reversal to the upside (in this case) as the head fake move is one of the last things to occur before a change in trend for several reasons, not the least of which is the momentum it generates on the reversal as we saw a smaller example of today on the GDX/NUGT charts.
Intraday the 1 min chart confirms with the TLT intraday charts as well as Futures intraday charts. The double top intraday (the opposite of the double bottom in TLT I showed) is showing a deeper negative intraday divegrence so I think it is legitimate.
However ay a mere 3 mins we still have a leading positive (still there) and I gave a "rough" guestimate of the pullback range, although a move below the recent lows would not be surprising either,
this is where I want to add to the TBT long or open new positions, of course as always we'd confirm positive divergences on the pullback to make sure.
And the 5 min with the trend line for a head fake or stop run move and the positive divegrence or accumulation of the supply generated by hitting those stops.
So far so good, if you are interested in a TBT long position I'd set price alerts for a pullback to the $62.50, $62.25, and under $62.


No comments:
Post a Comment