Today I actually started out yesterday in London around 6 PM local when the ECB's Couere gave a speech to an audience packed with hedge funds and let them know that the ECB would be pushing forward it's QE Summer purchases into May and June as summer liquidity is very thin and May has the highest net issuance of Euro bonds.
The only trouble is that the hedge funds had and approximate 14 hour advantage between the time the speech was given and the time the ECB made that information public.
The EUR/USD having dropped about -350 pips since Friday highs (
the 3rd biggest move since October 2011) with the ECB's private hedge fund speech with an initial reaction in EUR/USD and then about 14 hours later as the information was made public at the European open.
I was obviously interested if there were any tell-tale signs and took a quick look at a few relevant assets...
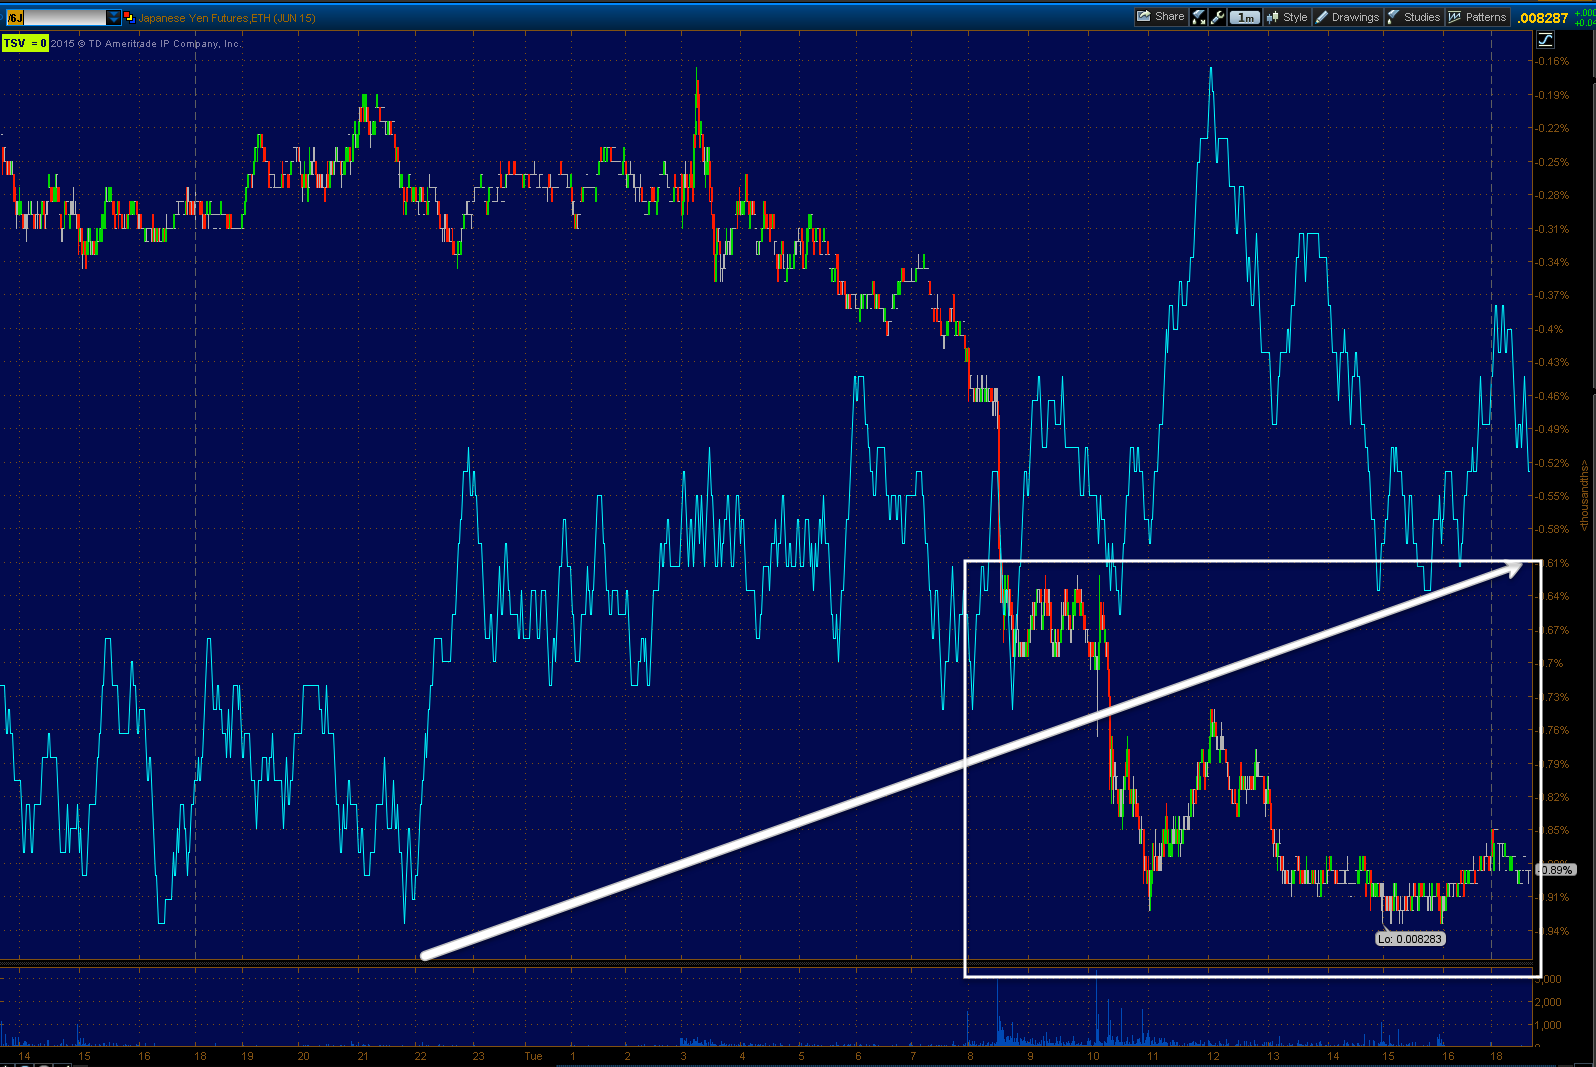
Euro futures with initial selling as hedge funds found out (green arrow) and heavier selling as the general public found out 14 hours later,
I don't see anything out of the ordinary, but I'm sure certain entities front-ran the (in effect) insider info.
Note the positive divergence in Euro futures as I mentioned toward the end of the day in several posts including, GLD Update where we have some currency sensitive positions.
I looked at the $USD which would gain on a falling Euro and there was a minor positive divergence right around the same time the hedge funds would have heard of the QE front-loading by the ECB in London last night and what could be a possible positive divergence just before the news was released to the rest of the world 14 hours later on the European open,
Note the $USD looks rather flat toward the end of day vs. earlier in the day.
And Es/SPX futures which essentially gained since the London speech and then really shot up as the information was made public, only to retrace all of the gains by the US cash open. creating a lower high and a lower low.
The 8:30 Housing starts created quite a ruckus as they came in at the highest level since November 2007, up +20% M.o.M. to print at 1.135 mn vs consensus of 1.015 mn. This was the second biggest M.o.M gain in the history of the data series and the biggest jump since 1991! The market took this as "Good news is bad news" and that it would mean rate hikes earlier as the $USD that has been setting up for a counter trend rally that started to breakout from yesterday, surged higher sending our GLD puts in t the green as Gold, silver, copper, iron ore and oil (commodities) fell on the stronger $USD as well as losses in Index futures and bonds.
60 min $USD chart showing our April 2nd forecast for a bounce (green) to be followed by a much larger downtrend which has seen a series of smaller counter trend bounces (yellow), but this one was expected to be larger based on the size of the divergence and the area the $USD was in.
One of the largest, strongest $USD accumulation areas we have seen since the downtrend started on 15 and 30 min charts with a "W" base. There looks to be plenty of upside still left in the $USD although I suspect a slight correction or consolidation.
The daily $USD chart showing the 2-day move
which is the largest 2-day move since October 2011. Remember what I said about "counter-Trend rallies"? They are some of the strongest you'll see as they need too be impressive enough to change opinions to be effective.
The daily $USD chart shows what appears t be the $USD carry trade unwind as the currency has made a lower high and a lower low on a closing and intraday basis, but was just below the support of an intraday low which is where I suspected a counter trend bounce would originate
(hit stops and punish shorts).
The $USD gains sent our Crude short lower, definitively breaking support and our gold parabolic put fade in the double digit green column with silver seeing the biggest move down in 3 months and copper the biggest drop in 4 months. Commodities as a whole were pounded on the $USD move.
Commodities (brown) vs. the SPX (green) clubbed lower with crude, gold, silver, copper an iron ore al lower.
This is exactly the move we have been anticipating and setting positions up for including oil short and gold puts.
The averages looked like this on the day...
On the day the major averages were pretty close with the SPX and Dow at -0.06 and -0.07% respectively and the NDX and R2K down -0.20% and -0.15% respectively. The big loser was transports down -.76%
On the week so far transports have lost all of their gains while the Russell 2000 leads.
As you probably know it has been 3 weeks since the April F_O_M_C meeting and the minutes are due out tomorrow at 2 p.m.
As I ALWAYS warn, "Beware the F_E_D Knee-Jerk Reaction , it's usually wrong and usually retraced within a few days.
However as you probably already know, the afternoon trade brought about some minor divergences in currencies that looked like a possible $USD/JPY decline and EUR/USD bounce which would mean a $USD decline or consolidation.
As for the USD/JPY, Index futures weren't much for following it today, unlike 6 months ago when you knew where the market would open simply by looking at the USD/JPY...
The USD/JPY in red/green candlesticks vs. Es/SPX Futures
(purple line) showing the European open, the US open and the US close. Again it's hard to look at charts like this and imagine it's not Carry trade (closure) related.
As for the Currency futures...
Looking at individual currency futures I see a slight intraday negative divergence in the $USD which I think is acceptable after the biggest 2-day move since Oct. 2011, again, that's the strength of counter trend rallies and I don't think this is near complete.
The Euro futures show a couple of negative divergences, one just before the ECB public announcement decline and then an end of day positive divergence.
This could be profit taking from the hedge funds front-running the ECB QE information or...
The 1 min Yen also has a positive divergence.
If these all fired it would result in a USD/JPY pullback, a EUR/USD bounce and a $USD pullback. It's hard to say whether they are profit taking or the real thing which would be perfectly logical after such a strong move.
What reinforces the corrective behavior in my mind is that I found these same divergences on other timeframes in the Euro and $USD, but not the Yen (only 1 min positive). This is the 3 min $USD with positive divergence before the break higher and an end of day slight negative divergence.
And the opposite with a positive divergence in the 3 min Euro futures and on this chart it does look like smart money or the hedge funds acted on the ECB information before the european open when the bulk of the move occurred.
I can track these divergences out to even longer timeframes and tomorrow's F_O_M_C minutes are a wild card that could do virtually anything unless we see a leak before them which is rare, but not unheard of.
The reason I'm not too concerned is whatever might happen short term, this divergence in the $USD, is very strong and I doubt very much that it is anywhere near done...
$USD 30 min positive divergence. The $USD may have gotten a boost from the good housing starts this morning, but unless there was a leak, it was moving higher no matter what with a divergence this large on this strong of a chart , furthermore, whatever may happen in the very near term (tomorrow), this divergence looks FAR from done.
Oil broke decisively sending our USO short firmly green...
Again , whether USO sees a bounce or consolidation, between the $USD 30 min positive and the USO 15 min leading negative at the breakout area, I'm not too worried as this should move significantly lower.
The same applies for GLD/gold. Even on a gap fill, the June 19th puts have plenty of time and the 15 min leading negative divergence and $USD positive suggest serious downside ahead.
We may have some new trade opportunities on any corrective moves so I'll be setting alerts in case anyone is interested in a second chance position in the case of a corrective move.
The question of whether the market can put in a head fake move stronger than this one...
SPX daily chart/ascending triangle... is still an open question. Under any other circumstances I'd say yes 99% as the approx. head fake percentage before a trend change in any asset and any timeframe is about 80%, this is that much higher because of the asset, the size of the price pattern, the visibility.
however, today wasn't exactly a stellar follow through day and there was a lot of weakness in a lot of places. Even USD/JPY couldn't lift it, nor did HYG...
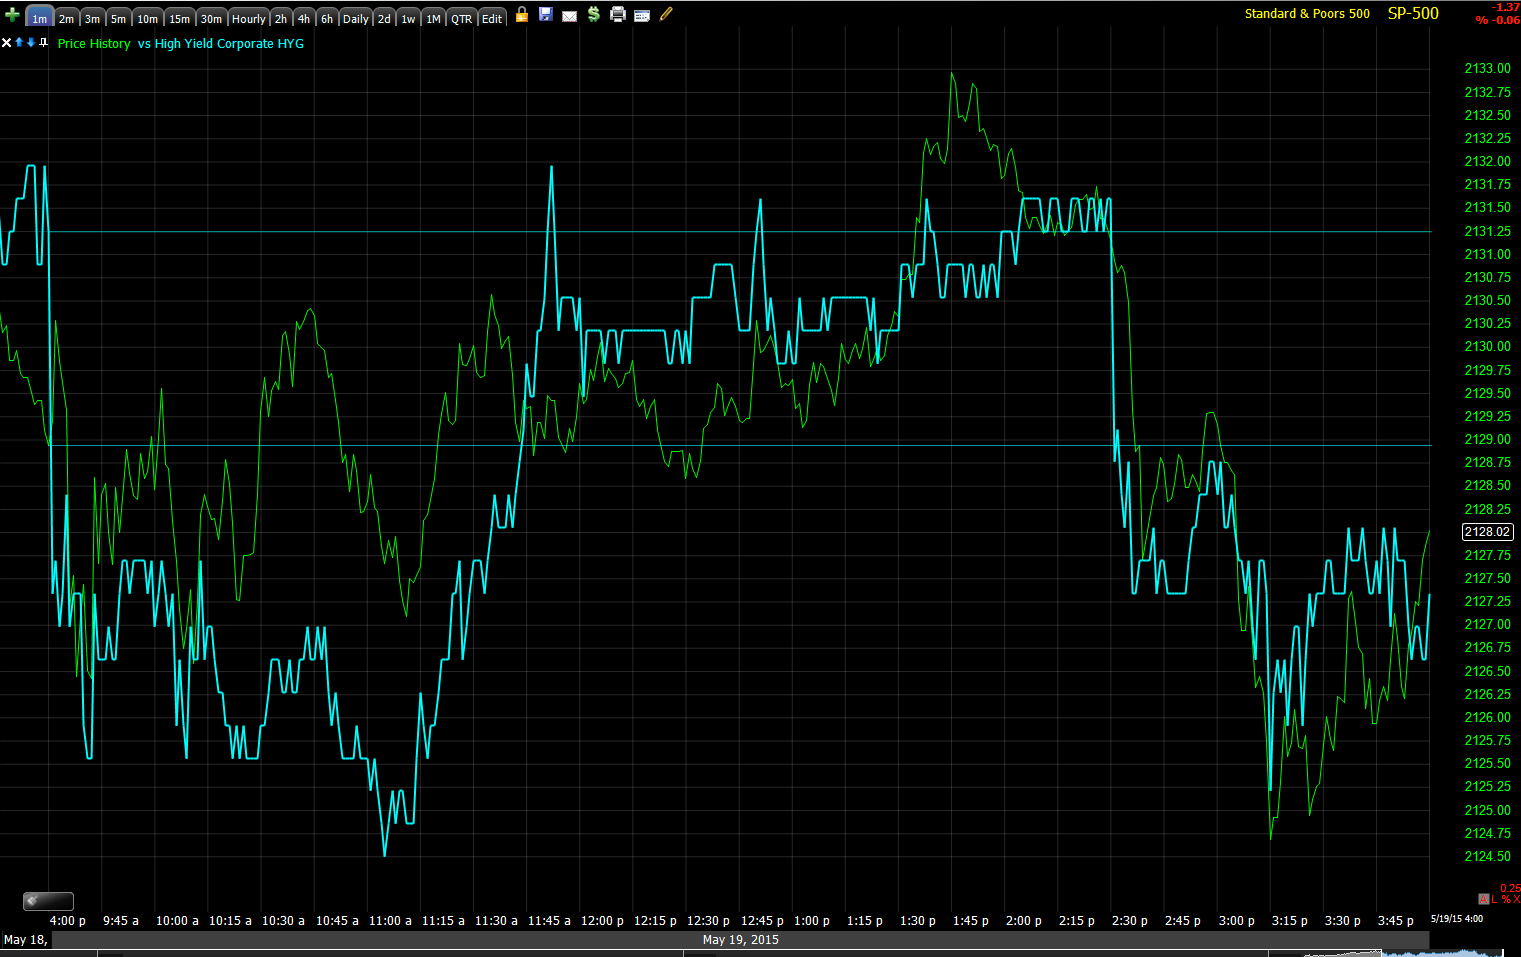
HYG vs SPX intraday...
And as was expected, HYG is diverging from SPX to a greater degree.
As is HY credit with the 4th day of divergence.
Here the SPX (green) is shown with its price inverted so you can see the relative performance vs spot VIX which looks a lot like protection has been bid very recently which is the same thing we've found in short term VIX futures.
It may be because of tomorrow's minutes, but VIX short term futures were seeing positive accumulation today and this in addition to an already huge 15 min divergence.
However, I haven't changed my position that I elaborated on Friday regarding the "gas in the tank" charts, mostly on the 10 min charts of the major averages. We could very well see a corrective move on a $USD pullback allowing the 10 min charts to go negative as all evidence has shown any sort of higher prices have seen distribution.
As far as where we stand with those charts...
SPY 10 min "Gas in the tank" bounce chart that needs to go negative.
QQQ 10 min
The process (
and that's exactly what it was called in Friday's "week Ahead", a Reversal Process") is working, but as the word implies, a reversal is a process, especially one I'm contemplating that is as large as I suspect this one to be...
The IWM intraday charts keep looking worse and the process of migration (
strengthening of the divergence) is under way...
5 min IWM leading negative more today than yesterday
And bleeding through or "migrating to the 10 min chart which is the Maginot line so to speak.
As I explained earlier today, the cap on the market is right above at the 15 min chart...
IWM 15 min through 2015. something very definitive changed in the charts as soon as January hit.
As for internals today...There were none today. No Dominant P/V relationship, 3 of 9 S&P groups closed green with Financials leading on the "Rate hike is good for financials" meme and Energy lagged at -1.42%.
Of the 238 MS groups a very mellow 104 of 238 were green. Again, absolutely nothing interesting about internals today.
As for futures tonight, other than the currency futures and the general migration process, tonight's specific futures aren't all that exciting, but I'll try to give you a few different angles...
YG/Gold futures 1 min with the small positive divergence intraday mentioned several times along with crude. The previous 3C trend at the green arrow is downside confirmation.
CL/Crude (Brent) 1 min futures showing the same thing which fits with the currency futures divergences so a consolidation/correction wouldn't be surprising, but this could also be as simple as profit taking.
The Index futures are rather blah tonight, this is NASDAQ Index futures as it was the cleanest example, otherwise they aren't giving away much.
However as you get deeper in to the trend with less noise like this Russell 2000 3 min futures chart, the distribution in to higher prices I mentioned is quite clear and they all look like this.
The process of migration is at work here too with Index futures...
This is gold 3 min futures with a clear negative divergence leading to today's move lower.
This is a 5 min chart of VIX futures, remember that accumulation/protection mentioned above today, well it's more than just today. This may be because of the minutes tomorrow, but I suspect it's part of the migration trend as well as this chart would confirm the next...
ES 5 min leading negative.
And here
And here we have TF/Russell 2000 futures 10 min from the positive divergence, note it's the exact same date and place as the averages above and that turning to distribution in to higher prices and leading exceptionally negative.
And NQ 30 min, which needs to see some more work done here, but again it's the same reversal process as the averages.
Tomorrow should be interesting, if we do get a move/correction in the currencies, it would set up some second chance positions for anyone interested or who may have closed gold/oil trades today to book the gains and may be looking for a new entry.
No one can say what the effect of the F_O_M_C minutes will be, but a knee jerk move on anything F_E_D is so common that I ALWAYS warn before any F_E_D event to beware of knee jerk reactions, they are rarely what they seem to be.
Have a great night!


No comments:
Post a Comment