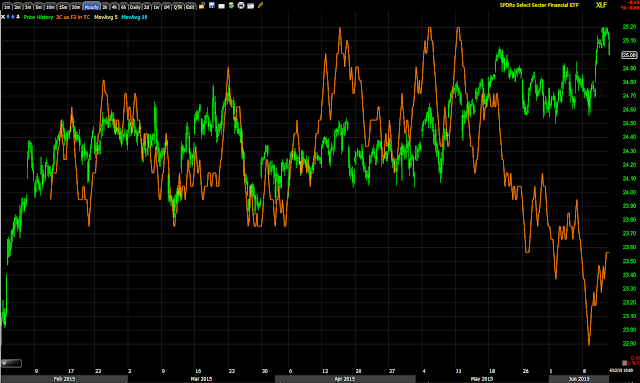
Yesterday I updated the XLF/Financials charts in the Daily Wrap.
Here's a quick rundown of them...
Short term intraday charts look like the major averages, bad and as timing charts, they seems to be telling us XLF has hit its high banning an unforeseen shake-up in events with something like a Greek rescue.
The 3 min chart
The 10 min chart which is showing this week's move above 3+ week resistance to be a head fake move or false breakout.
And most importantly the big picture at the 60 min chart, Financials never recovered.
For this one, I'm looking at something with some leverage,. but also some staying power for more of a trend trade, thus I like either the 2x leveraged short financials SKF or my preference the 3x leveraged short Financials FAZ here.
If we get a bounce, I'd look at puts.


No comments:
Post a Comment