Showing posts sorted by relevance for query orcl. Sort by date Show all posts

Tuesday, March 20, 2012

ORCL Follow Up

ORCL is in a similar situation to WMT as a short trade idea...

 Here's ORCL's Top and a bear flag that failed to reach the upper trend line. ORCL is different then WMT as ORCL is near the bottom of the bear flag rather then the top.

 Here's ORCL breaking below the bottom, if you follow the Edwards and McGee Technical Analysis dogma, then ORCL was a short yesterday and would have been covered yesterday as well, the market understand technical analysis all too well and uses it against technical traders every day like what you see here. ORCL is still an excellent short in my opinion, at least for an initial move to the large descending triangle's lower trendline, (it will probably see volatility there and then make for an even better short). So ORCL is lingering at last support, so again, at important technical levels, the breaks are never as clean in the real world as they are in the T.A. books and seminars.

 The 2 day Trend Channel does a good job in holding ORCL's moves, however, if they run a shakeout and this is just experience and gut, I have no evidence, then near the Trend Channel stop out (on a closing basis), there is a very juicy looking level of resistance, a break through that (at the yellow trendline) would almost certainly shakeout shorts. This is why I prefer wide stops on initial positions, it would be a shame to get booted from a good short on a shakeout move. Just be aware of the area and remember psychology, the market is about fear and greed, the more powerful a shakeout or head fake move, the more it moves emotions which for too many traders dictate decisions.

 The 60 min ORCL chart is ugly, this should easily move to the lower Triangle trendline and after some volatility, much lower.

The daily chart is showing the same negative divergences as well, except this time ORCL wasn't strong enough to make it to the top trend line of the top pattern.

Monday, May 7, 2012

Did Someone Follow the ORCL Short Trade Idea?

ORCL was a short trade idea from the end of March (this link is a search for ORCL and as you'll see there were numerous updates on the trade at the end of March). This trade idea started in the middle of March, I haven't been able to read all the updates, but the March 22nd looks like a good one as it shows the March 20th post, what we were looking for to happen to enter and then 1 day later we got exactly what we wanted-LET THE TRADE COME TO YOU!

 This is the area where we wanted to see the trade move to so we could enter a short position on strength, but also a head fake move and where the trade is now. However, the trade has a lot more potential than this.

 On a weekly chart there's a preceding uptrend and then a large right angle triangle. Triangle's this big (see BIDU) are almost never consolidations and almost always either tops or bottoms depending on the preceding trend, with a preceding uptrend this would be considered a top. The price pattern implied target is around $14 or about half of where price is now.

 During March we were looking for signs of this counter trend flag-like rally to give us an entry signal. On March 20th in an update I wrote about the level of resistance at the yellow trendline specifically saying,

"ORCL is lingering at last support, so again, at important technical levels, the breaks are never as clean in the real world as they are in the T.A. books and seminars.

The 2 day Trend Channel does a good job in holding ORCL's moves, however, if they run a shakeout and this is just experience and gut, I have no evidence, then near the Trend Channel stop out (on a closing basis), there is a very juicy looking level of resistance, a break through that (at the yellow trendline) would almost certainly shakeout shorts. This is why I prefer wide stops on initial positions, it would be a shame to get booted from a good short on a shakeout move. Just be aware of the area and remember psychology, the market is about fear and greed, the more powerful a shakeout or head fake move, the more it moves emotions which for too many traders dictate decisions." 


This is an excellent head fake move, you can clearly see it was so obvious that it was predicted the day before. What made it obvious? First the flag-like uptrend had to end, second ORCL was starting to move toward breaking the channel, third the area of resistance was so well defined that traders in ORCL wold have set orders and stops there making it almost certain it would be hit. Remember when you place any kind of limit or stop order with your broker, everyone on Wall Street can see it, that is why I use market orders to execute the trade right away without giving Wall Street a head's up of my intensions, it may not matter in a big stock like ORCL, but in smaller stocks it does and when short term trading it does. The main point is so many traders using these orders would have made the area very obvious and an easy target for Wall St. to shakeout and trigger orders that would later be at a loss.


 We already knew that Money Stream had confirmed the distribution in the top pattern so entering the trade and managing it were all that were left to do.

 On the 30 min 3C chart every attempt to rally was distributed, the yellow box is that head fake move above.

 The 5 min chart shows the head fake move clearly, it's the price area sticking straight up, again, all price strength has been sold in to.

 Here's the most recent decline in ORCL on a clear negative divergence, there's also a relative positive divergence so if you missed the trade, it may come back to you allowing you to enter or add to it on some price strength.

Since ORCL is still technically in the top, it is very volatile, I would use at least this 5 day Trend Channel as a stop and maybe even give it some extra room. The bottom line is I wouldn't want to get stopped out of an excellent looking long term trade because I too too many shares with too tight of a stop. You can always add as the trade moves in your favor. For those of you who haven't already read my article from Trade-Guild.net (my free site), check this one out: How to Make More Than 100% in a Short


Monday, March 19, 2012

ORCL Follow Up

ORCL was a trade idea (short) from March 13th. ORCL has poped off several alerts this a.m., this is kind of a similar situation like we see in WMT.

 Here's the long term daily chart and what I believe is a large descending triangle top.

 Note there is a bear flag breakdown and ORCL has not been able to make it to the top resistance trendline, often a sign of weakness, especially useful in broadening tops after 5 points of contact with the trend lines.

 ORCL today is just below the bear flag, there could still be some volatility on the break of the flag's support, but ORCL looks like it's falling apart here.

 The 60 min chart of the bear flag has been leading negative  since about the time ORCL popped out of the bear flag on a shakeout move.

Here's the more recent 15 min chart showing a leading negative divergence, so it's no surprise ORCL is where it is.

Email me if you need stops for ORCL, obviously there are several different length trades one could take considering we still have the top's support below.

Wednesday, March 20, 2013

ORCL Looks Worse Than You Might Think

I haven't seen all the particulars, but it seems ORCL's earnings were a disaster, missing on  multiple business levels that they had just guided on recently.

In any case, I have some charts, it's definitely a "Put it on the radar" asset because we don't want to chase something like this.

We actually traded ORCL around March of last year short and appear to have had several members do very well with different trades.

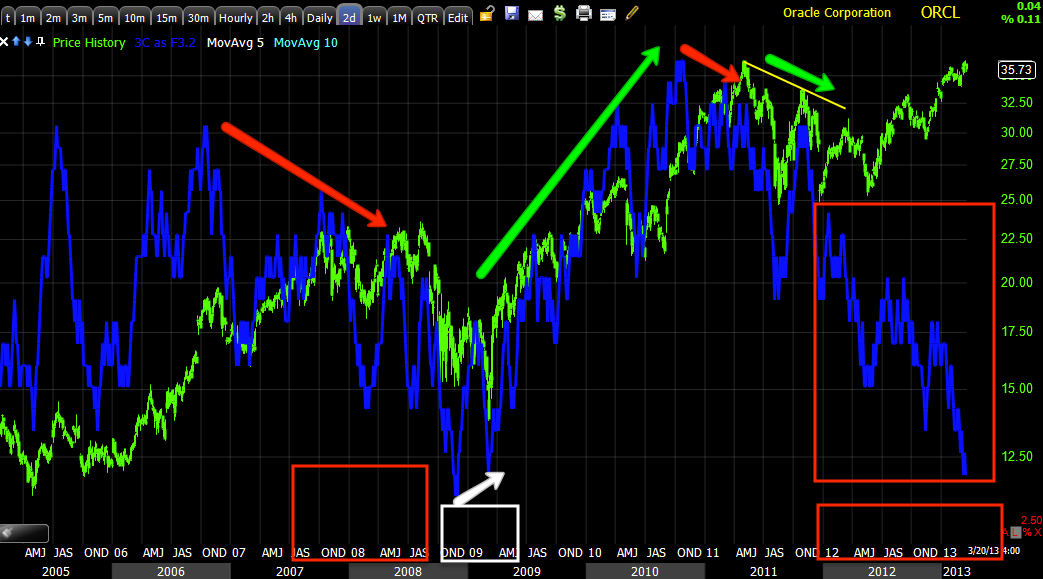
 I first suspected this was one of our trades when I saw the triangle trendlines drew in as I pulled up the chart as well as a channel that is harder to see within the triangle. It looks like 2007 was going to be a top of some form until QE1 rescued the entire market early 2009, but looking at the trend since 2002 or even further back, this triangle is significant. Tops often share some relation in size vs how long the trend existed.

Volume is horrible from 2012 forward.

 I'm using a longer term 2 day 3C chart here which shows some distribution far left around 1990 and ORCL lost ground, then had a confirmed trend up for 7 or 8 years before red flags started showing up at the 2000 Tech Bubble top, where it once again saw distribution (also leading). One of the most obvious red flags was the upside change in volatility/trend, although it feels great when you are long, it also makes a lot of people fall in love with the stock and when it starts to fall they hold because they made so much money in ORCL in the past, they just know it's coming back. ORCL lost somewhere around 85% in the tech crash. "Changes in character lead to changes in trends" and the parabolic move up shows exactly why I don't trust them because they tend to end just as extreme and bad as they went up.

At 2002 ORCL bottomed which was the start of the new bull market that gained momentum in 2003, there's accumulation there, although it doesn't look large, it's 5 intense months and shows signs over the next two years into 2004. Obviously the 2007 distribution / top is clear as is the 2009 bottom

Green arrows are trend confirmation, ORCL had a lot of that in the 1990's. The current negative divergence is leading negative and by far the worst.

 Here's a closer look from the 2007 top to present.

 MoneyStream is a totally different form of money flow indicator, but a good one and it confirms the same as 3C on a 2-day chart, 2007 top, 2009 bottom, leading negative distribution now.

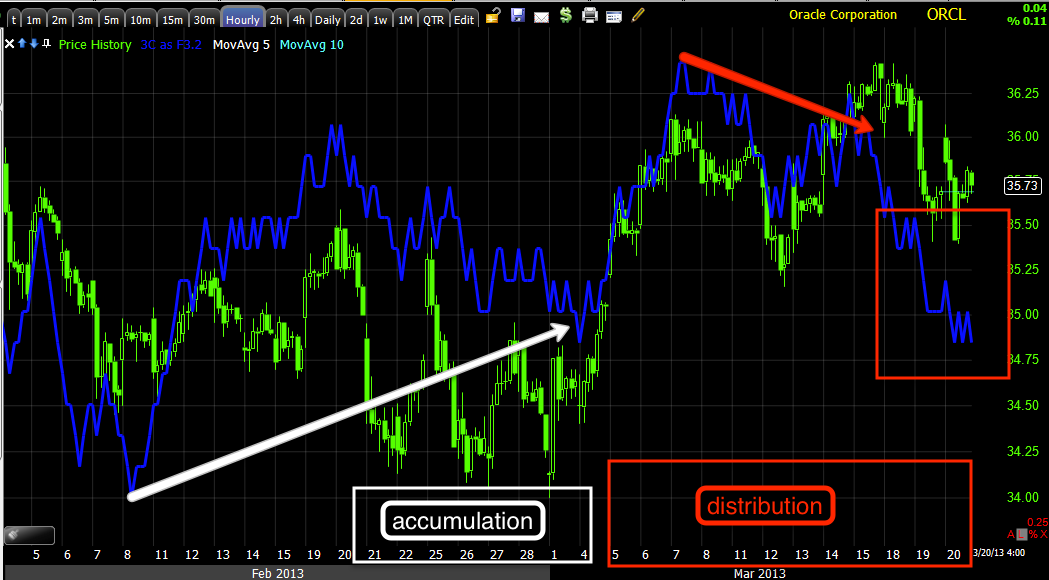
Here's an hourly chart showing what we often see before a stock breaks hard, accumulation that serves to lift the stock and then distribution in to higher prices and demand.

When I was capturing the charts I wasn't sure if we traded this one, I looked and we did.

There are numerous posts on it, but march 20th of 2012 there was a post showing what we were looking for to happen,

"if they run a shakeout and this is just experience and gut, I have no evidence, then near the Trend Channel stop out (on a closing basis), there is a very juicy looking level of resistance, a break through that (at the yellow trendline) would almost certainly shakeout shorts. This is why I prefer wide stops on initial positions, it would be a shame to get booted from a good short on a shakeout move. Just be aware of the area and remember psychology, the market is about fear and greed, the more powerful a shakeout or head fake move, the more it moves emotions which for too many traders dictate decisions."

The chart and juicy shakeout level?

 This was the area we were watching for a set up...

This is the juicy level and entry on a head fake move that completed that same day, beautiful entry. The trade lasted until May.


ORCL has much bigger problems that I think most understand with that level of distribution, it's the worst divergence in multiple decades. 

Thursday, March 22, 2012

ORCL Trade Follow Up

ORCL is still in good position for a short. My update of March 20th can be found here. In that update I said,

"ORCL is lingering at last support, so again, at important technical levels, the breaks are never as clean in the real world as they are in the T.A. books and seminars.

The 2 day Trend Channel does a good job in holding ORCL's moves, however, if they run a shakeout and this is just experience and gut, I have no evidence, then near the Trend Channel stop out (on a closing basis), there is a very juicy looking level of resistance, a break through that (at the yellow trendline) would almost certainly shakeout shorts. This is why I prefer wide stops on initial positions, it would be a shame to get booted from a good short on a shakeout move. Just be aware of the area and remember psychology, the market is about fear and greed, the more powerful a shakeout or head fake move, the more it moves emotions which for too many traders dictate decisions."

Here's the ORCL chart 

The white arrow is the March 20th post as ORCL lingered around the bottom of the bear flag, the yellow trendline is the area mentioned above and yesterday was the shakeout. Usually the last thing we see before a reversal is a good head fake move like yesterday's so I still like ORCL and it hasn't moved so far from a reasonable risk management position.


Wednesday, March 14, 2012

ORCL Follow Up

Yesterday I presented ORCL as a trade idea (short), the post can be found here.

Like PCLN and RIMM, ORCL didn't do much of anything yesterday, it's moving today.

 Here's the long term top as a reminder...

 And here's the channel that had several options for different trade entries in yesterday's post.

 ORCL is moving down and moving in to the gap, the gap is also near the bottom of the uptrend channel, note in the red area ORCL did not move with the market yesterday (one of those breadth incidents). I take that lack of participation as weakness in the stock, but again, see yesterday's idea for more details.

 Here is ORCL moving down and in line or trend confirmation.

The 2 min chart is leading and looks worse. See yesterday's post for all of the charts.

Tuesday, March 13, 2012

ORCL Trade Idea (Short)

There are a number of different ways to play this idea, from short term trades to longer term trade, options, straight equity shorts, etc. The reason why is it appears to be a long term top that is near completion, but there are also shorter term components of it that look as if they are close to moving. Lets take a look at it first.


 ORCL on a 5 day chart, you can see a long term up trend and what appears to be a descending triangle top, a very large one, but about the right size for the trend.


 On a daily chart you can see how big the top is, ORCL not making up to the top trend line on this recent move (and I don't think it will make it there, is a sign of weakness, it's most often seen a sell signal in broadening tops after at least 5 points of contact with the trend lines, which we have exactly 5 points of contact. There was also a recent very strong gap down on big volume that found support at the bottom of the pattern for a bounce.

 Here's that bounce in a channel.

 For perspective, I drew some trendlines on this 60 min chart representing the top pattern. You can see the accumulation periods have been much smaller then the distribution periods, remember, Wall Street wants to sell in to strength, they need those bounces to do that.

 Here's a closer look on a 30 min chart,  just like the 60, the 30 min chart is recently negative in the channel.

 The 15 min chart is also leading negative, while there's a chance ORCL tries to break above the recent lateral movement of the last week or so, I doubt it would be able to hold very long. Furthermore, I have some doubt as to whether it can even make that move, the broad market will have a lot of influence on that outcome.

 The 5 min chart shows this gap up as unsupported...

As does the 2 min and the 1 min below.

There are several ways to play this, a move back inside the gap would be one potential set up, a move below the channel would be another or if it can manage it, a move to the recent lateral range would set up a beautiful trade, but again I have doubts about it being able to do that.

As usual, I would prefer initially a wider stop with fewer shares, but it depends on how you are looking to play it. I'll set some price alerts and keep an eye on this and update any set ups that form.

Don't forget ORCL

ORCL was a short idea earlier this morning, it's hitting alerts left and right.


 ORCL moving in to the gap? The top channel trendline is right below

 1 min

 2 min

5 min

ORCL has been falling apart all day on 3C.

Wednesday, March 21, 2012

QQQ Update

The Q's have been the strongest and that is because of AAPL, thus the reason I posted this early today specifically on AAPL and the Q's

Here's how the Q's looked in to the break

 QQQ 2 min

 QQQ 5 min, notice how quickly the 5 min went negative...

 The QQQ 15 min showed it was already skating on thin ice.


You may recall I updated ORCL yesterday and said the Edwards and McGee Technical analysis doesn't work anymore. ORCL was breaking below the lower trend line, Technical Analysis says it's a short right there and then, I warned that there's almost always a volatility shakeout when important support is broken, ORCL did exactly that today and in the process took out 3 weeks of longs in 1 day.

Wednesday, March 20, 2013

Market Wrap

Despite the overnight ramp in the EUR/USD which is supposedly because the Finance Minister of Cyprus remains "Hopeful" that a deal can be reached with the Russians (no other details-just "Hopeful"), you know there are economic problems when Fed-Ex looks like this...
This is bad economic news, not because of the Dow Theory confirmation of the Industrials vs. the Transports because we aren't an industrial dynamo anymore, we're more services oriented and Fed-Ex is representative of shipping for the services sector, they aren't moving coal, steel, grains, cars and such, they're moving goods and a lot of things related to the services industry. If you wanted to update Dow Theory you might compare Fed-Ex to the Russell 3000.

 I'm not going to make a case on this one chart, but this is part of putting the pieces together to see the bigger picture, FDX did not make a new high with the Transports around 3/15. This might be one part of your analysis and if you found a trend of similar or confirming indications, you can start to build your case and see if it holds water.

As for the market overnight and the movement in the market today was all about the overnight session and the gap open, the rest of the day wasn't all that impressive.

While some say the Euro rallied on the "Hope" statement from the Cypriot Fin-Min., others think this is indicative of Euro repatriation flows, essentially EU banks selling overseas assets and converting the money and bringing it home to shore up their capital base which is the Achilles Heal of the EU. The problem I see is that most of the investments would come from the US and during the overnight session not many US markets are open to sell those assets. I think this could have just as easily have been ECB intervention to try to get back to EUR/USD $1.30 or it could have been algos just driving up the ask, whatever the reason, it drove Futures with it.

Again Swiss 2-year Yields fell again, further in to the negative (it's costing the buyers money to hold the asset), this should tell you something about the nature of the sentiment in the market. Credit markets in the EU which I showed you last week were diverging negatively away from stocks and it turns out credit was right as the Cyprus affair happened over the weekend. EU credit is lower now than when the Cyprus affair started so they are still very fearful, whereas European stocks for the most part just whistled past the graveyard (except Spain).

I'll skip over Bernie for the moment and head to Japan where the Nikkei reported that the BOJ Governor is going to call for "Bold Easing", which is such non-news. I mentioned the Yen yesterday and showed you some market correlation and as it were the Yen was losing it's downside momentum that Japan wants to keep up so they regurgitate this story that everyone already knows and it does the trick, they jawboned the Yen lower.

Here the Yen moves lower on the news as it was in danger of more lateral movement.

Interestingly, the F_O_M_C statement which to me was a progression of the drawing down of expectations that started as QE3 was announced in September, continued today; perhaps that's why the F_O_M_C release was so bland as far as the market was concerned, this wasn't anything like a normal, initial knee-jerk move.

The 2 p.m. release just didn't do much, nor did the press conference, after hours as you can see (2 blue hash marks next to price) is not thrilled with ORCL earnings.

Context may not be that surprising to you..
 ES vs the CONTEXT model.

However as I suspected earlier in the week, Credit and a few other risk assets used in the Risk Asset layout, were used to try to ramp the SPX up to that new closing high, I was shocked to see it again (now confirmed that was what was going on) and even more shocked that it didn't work for the 4 measly points-lets just get it over with already and move on.

Check out the SPY Arbitrage model and especially later in the day after Bernie failed to ramp the market, the model is ABOVE the SPY and I can show you why, but I can't help but about how weak this market must actually be if the F_O_M_C, Bernie and these coordinated ramps couldn't pull 4 points for the SPX. The safe haven buying is clear and the willingness to sell (FDX / ORCL are reminders) is clear as well, there just apparently isn't enough willingness to take risk on for 4 minuscule points.

I first noticed it in the very liquid High Yield Corp. Credit (HYG)
 First HYG seemed to step in to move to highs of the day on exactly what? Well whatever, it didn't get the SPX any higher.

 Junk Credit was in there as well, just as the SPX was starting to come down, credit comes to the rescue, but doesn't make the 4 points.

 The radical moves in High Yield Credit (as it is less liquid) took way all of the gains for the year in two days and then popped back up (again it's low liquidity), but check this out...

 As HYG in blue failed to ramp the SPX, it looks like HY in brown got scared and sold off.

It even looks like VIX futures ended the day stronger than the correlation would otherwise suggest, perhaps reaching for protection or just an inaccuracy in the ETF?

Normally the VIX would be making a new low with the SPX making a slightly higher high.

And you saw plenty of posts on the VIX futures today, they seemed to have plenty of interest.

As for FX...
 The really tight correlation with the Euro slipped at the end of the day, more than it has the last 2-days, wonder why?

 The $USD was seeing strength since the gap down and especially in to the close, not helpful for the SPX.

The Yen probably doesn't hold a lot of meaning here, I wouldn't think this is significant other than the fact the Japanese are desperate to keep the Yen down until the new BOJ governors can try (they are only 3 of 9) to embark on their bold new QE to quell 20 years of deflation.

More on the Yen...
 The trend in the EUR/JPY has recently broken and the Japanese aren't happy about it, they want this chart rising and the Yen falling, but this could very much be indicative of the wrapping up of the carry trade, breadth seems to suggest that pretty strongly, whatever it is with the most dovish PM and new BOJ leadership ever you'd think this chart would be soaring vertically, but the BOJ needs to come out and tell the world again and again just how serious they are to keep if from falling and if the Carry is being closed as I suspect, they may have a hard time.

 This is the lateral movement they don't like, they want this chart moving up, not down.

You can see the BOJ's jawboning today, I think I'll chuckle or maybe even "LOL" if this chart falls and the Japanese come out again and tell us how super, super their QE is going to be, each time infuriating the Chinese.

A for Ben, the bottom line today is I didn't see anything that really stood out in the market, a few things here and there, but there was definitely a continuation of slow boiling the frog, he mentioned more than once the costs of additional easing vs. the benefits as well as "reviewing efficacy, costs and risks" as if he meant risk to the market as in a bubble... and you heard that hear before you did from the F_E_D as it has been obvious ever since they changed their Calendar based "yard stick" to a much more arbitrary and easy to manipulate, economic based. I guess they found it was going to be hard to manipulate dates on the calendar :)

The futures don't look very impressive, but I'm going to give them some time to get over earnings and see what happens later tonight, I'l just remind you of the signals in the VIX futures (yesterday's and today's).

Oh, by the way, tomorrow is a pretty heavy economic day, we have:

I'm sure I'll post again tonight before I turn in, I do think this market is a lot weaker than people realize, FED-Ex's sell-off, DE's, and of course ORCL are what happens when the market is let lose to discount, at the same time every little ramp trick can't get the SPX up a fraction of a percent to new highs, while the safe haven flight is everywhere around us.