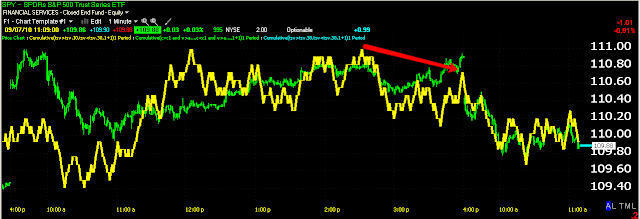
Here's what 3C looks like right now and it's not surprising. The idea today, I believe will be to get the recent longs into the red, this creates the downhill snowball effect-the Judo Concept-what this was all about in the first place.
The charts....
Above a 1 min. 3C chart of the SPY-the red arrow shows Friday's close going negatively divergent. Right now 3C is in line with price, confirming the trend down.
This is the 5 min SPY chart you saw last week showing them selling the rally the entire time, the white arrow is accumulation so they'd have something to sell. There's nothing unusual here, except that for some reason you can't see the leading negative divergence 3C is in, that's why there's a red arrow pointing down. I somehow got a bad screen capture, but 3C is at new lows, not in the current position on the chart above.
Above is the 5 min QQQQ chart. Again you see the big negative divergence-remember I said that the Q's and Russell outperformed, you can see they started distributing the SPY before the Q's or at least to a greater degree. Again the white arrow is the accumulation of stock/inventory to sell into the rally-extra money in their pockets. Again, this time the chart shows it correctly, there's a new low in 3C creating a leading divergence-this is showing extreme distribution and is in-line with price action this morning.
A 1 min. chart of the SPY, I think that gap may provide some temporary support-perhaps intraday, we'll have to see how fast we fall, but there should be at least a consolidation in the area. If it slices right through on heavy volume-as you can see the volume rise as it fell out this a.m.'s bear flag, then that would be extremely bearish and a snowball down will build momentum.This is the end game of what was started at the end of August so consider using your advantage, just be on top of risk management. We have had an amazing prediction here, but we are not invincible.


No comments:
Post a Comment