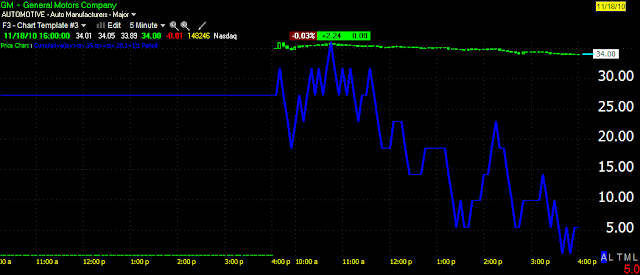
I previously though that institutional buying showed up first on a 10 min time frame. A few months back I saw something that changed my mind, that it really could be spotted on a 5 min chart as well, which previously i had thought 5 min charts as with 1 min charts were pretty much just market maker/specialist types moving money in their accounts around for a shift in trend as they see the orders coming in.
In any case, this is proof positive that the 5 min chart shows institutional sponsorship.
Here's GM yesterday at the close. Last night I wrote that nearly the entire issue's float was churned yesterday, putting shares in the hands of retail and out of the hands of institutional as no positive divergences showed up whatsoever and GM lost a buck.
Here's an updated chart this morning with institutional sponsorship as they try to keep GM above $33. It'll be interesting to see the point in which they stop sponsoring it and see if it falls again.
And here's a closer look at the actual price movement caused by that sponsorship-taking prices off the low of the day and moving them up.
Is interest rates about to start going up?
-
Yes, I know - it does not make any sense - FED is about to cut
rates...but....real world interest rates are not always what FED wants it
to be.
6 years ago


No comments:
Post a Comment