The daily SPY chart has been in a relative negative divergence for some time, interestingly, today at new highs, the 3C chart did not confirm at the far right arrow.
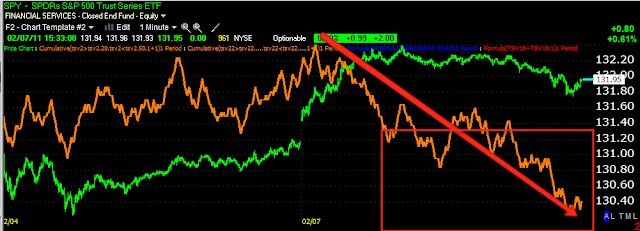
The 1 min chart.
5 min chart-in the red boxes are leading negative divergences.
The 15 min chart which was untouched earlier is looking worse
Now we have a relative and leading negative divergence all the way to the 30 minute chart today.
We'll have to watch for inflows of capital as the 5 min. chart showed a slight positive divergence
Is interest rates about to start going up?
-
Yes, I know - it does not make any sense - FED is about to cut
rates...but....real world interest rates are not always what FED wants it
to be.
6 years ago


No comments:
Post a Comment