2 p.m. is the time we usually see some market hanky panky-the close is the most important, around 3:30 the day traders start to close out positions, so lets see what's cooking.
SLV
OK, still not seeing intraday price activity that looks like short covering and right now our daily candle has traced out an evening star which is the first part of 2 candles for a reversal. The action alone shows a loss of upside price momentum-thus short covering? Probably not seeing a lot of that.SLV 1 min in a lateral trend, good for distribution and a 3C negative divergence. There has been no upside since the negative divergence.
The 5 min 3C chart is looking worse, it's in a leading negative divergence and there's been no upside confirmation for today's price move, again not really a healthy looking chart right here and my guess is that a reversal is brewing.
SPY

Today's confirmation candle of yesterday's star is also suggesting a reversal in the SPY-which could be VERY serious for market downside as I showed yesterday with the close only chart of the S&P, it was "kissing the support goodbye". Now I'd be surprised to see the market allow such a traditional reversal without some games, but if the Fed is no longer able to steer the market, then what we are seeing may be the real deal, we may finally be seeing a transparent market and according to the amount of accumulation that caused this correction, the reversal here would make sense.

Intraday, 2:00 p.m. hanky panky, we have a very obvious "bullish" descending wedge so we may see that intraday upside that muddies the reversal from nice and clean to .... questionable. Ultimately though, you have to remember the bigger trend and intraday hanky panky is just that.
Here's the positive intraday 1 min divergence suggesting the wedge breaks out to the upside...
5 min though, which is more serious is not showing the same, just downside confirmation. However if we do see a positive divergence form here, then we can look forward to the muddy reversal.
USO
The 1 min 3C with the positive divergence of late yesterday noted earlier, and we are seeing confirmation of the price trend today.
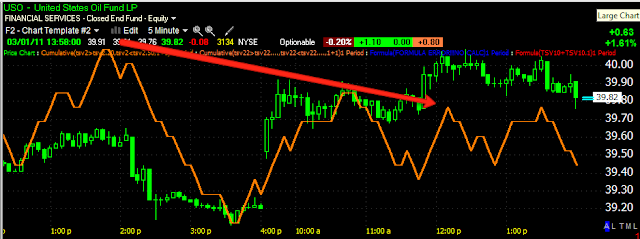
The 5 min is a bit more negative, not too bad of a divergence, but we don't want to see it develop. Remember I said earlier, "I'm not convinced that the correction in USO is over yet".
The 60 min chart which is a broader view is still in line which to me suggests that even if we do have more correction/consolidation, we still have a bullish longer term outlook in USO.


No comments:
Post a Comment