CCJ is in the nuclear energy sector so it was hit hard recently with the bad PR for nuke companies.
Over the last week or so, it's fallen by about 25%. This is part and parcel of the market's pendulum effect.
The downside event and volume associated with it is reminiscent of a capitulation event meaning all those who wanted to sell, sold, but usually that is after a prolonged sell-off so we are dealing more with a knee jerk reaction. Still, the oversold condition sets the stage for a decent bounce, whether it be a dead cat bounce or whether the company returns to more reasonable valuations. Today's candle pattern taken with yesterday's, forms a Harami Reversal in Japanese candlestick charting (that's slightly ironic) and suggests an upside reversal.
However, as you can see by the daily 3C chart, distribution in CCJ started sometime ago before Japan. There was a 7 month uptrend so the size of distribution (remember the point is to sell into higher prices) seems about right. So irrespective of a bounce, there are some problems with CCJ and it was headed down anyway, it just got there lot faster after Japan.
Remember I mentioned the 2-day candlestick reversal pattern (Harami), so seeing accumulation on the 15 minute chart yesterday and today isn't surprising, it's exactly what I'd expect to see on an ideal chart. Furthermore, 15 min divergences are about where we expect to see 3C based reversals.
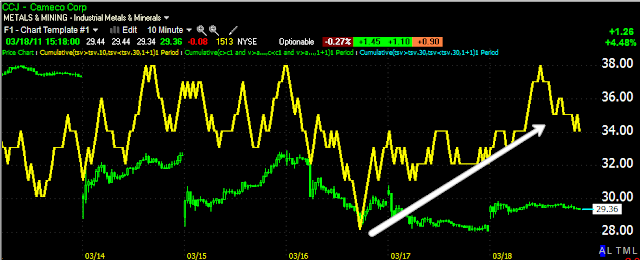
The 10-min chart is confirming the last two days of accumulation as well.
The accumulation period here is rather short so this points to a bounce, not a sustained recovery at this point. Still, for those of you who have the risk tolerance for this kind of trade, there seems to be an edge there and I'd guess that it would take 3-4 days to distribute the position, so we could see a decent bounce here. Longer term, I probably wouldn't consider this stock as a position trade.


No comments:
Post a Comment