So if you remember, we were looking at bear flags in GLD and SLV-both bearish consolidations. Earlier I showed an email in which I had said I'd expect a false breakout from the obvious flag pattern and it seems that is what we saw today. Both are looking bearish still, but slightly different. SLV appears to maybe have another day in it, GLD appears it is close to or is done.
GLD 1 min chart has gone into a leading negative divergence, not a very sharp one, but it's still there and volume today has been noticeably large and red.
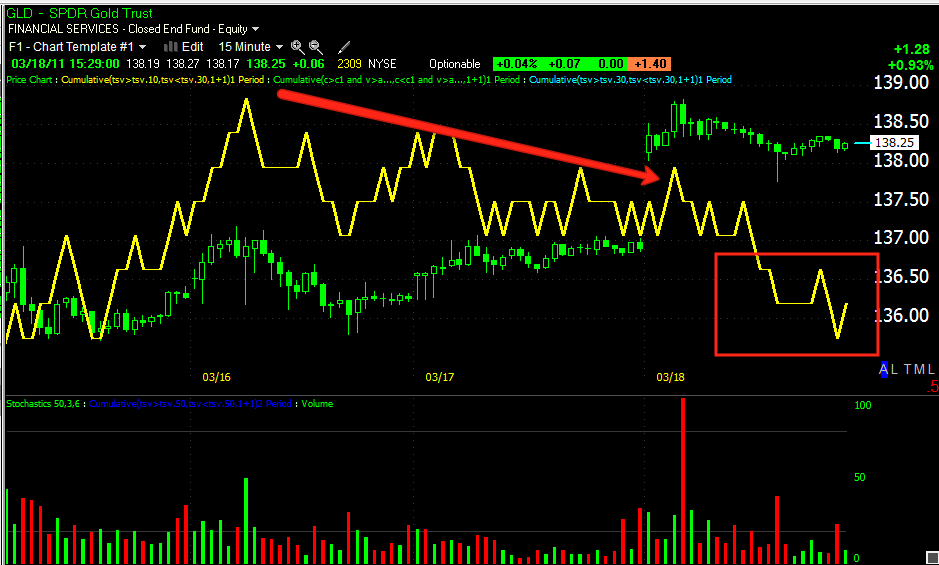
The 5 min chart looks very similar
As does the 10-min chart
The 15 min chart is leading negative, I'd say probabilities re this is the false upside breakout of the obvious bear flag and GLD is done or just about there, possibly Monday it puts in a day that is similar to today in the same price area before tumbling down.
SLV, unlike GLD has had a strong afternoon suggesting there's perhaps another day of upside in store on Monday.
However, the mid term charts are bearish with slight leading negative divergences, so it looks like there's been distribution into today's gap up and note how SLV didn't do anything beyond the gap up further strengthening the idea that distribution has been underway into the gap up.
The negative divergence hasn't reached the 15 min yet, but it's on the 10 min. Note the price pattern of a continuation triangle, this will suggest to traders that SLV will move up on Monday which it may very well do. However, I'd be watching for the bulltrap on Monday. Both charts still have a longer term bearish outlook and this is just the market doing it's thing, taking advantage of traders who refuse to adapt to the changing dynamics in the market.


No comments:
Post a Comment