Friday, April 29, 2011

Algos Gone Wild

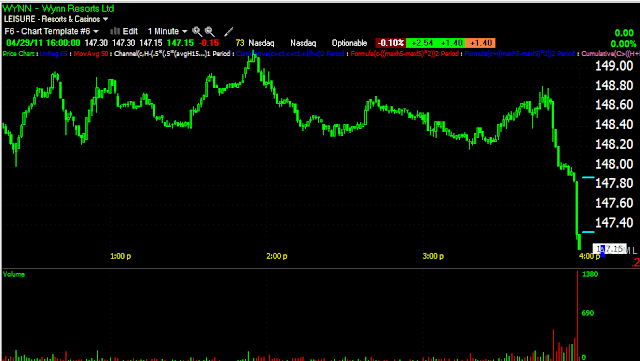
I think you might agree and may have noticed some of the strange closing trade, as if Chinese Hackers got into the order routing system. In any case, pay attention to the charts, many that had a big move in one direction or the other, seem to be heading in the opposite direction in after hours, I marked it on the ORCL chart, but the two horizontal blue hash marks next to price are the bid/ask in after hours as of the time I captured these screen shots. There are hundreds more. There was some strange stuff going on pre-close, I expect we're going to hear some strange report in after hours. While I believe there's some NASDAQ re-balancing, I don't think all of these stocks are NASDAQ components and I'm not sure the last minute stuff makes a lot of sense in trying to make that argument.


 ORCL***


Flash Crash or bad Print?

Considering last night in the IWM, who knows...

An Odd few minutes in the Q's

Dow Breadth

Earlier the Dow was up about .55% leading the market, now it's given back some at +.27%

Here's the Dow Breadth scan I mentioned earlier.

 % of stocks above/below the 1 min 50 bar moving average. In the white box you can see how quickly the percentage changed, this is likely because of the lateral trend most of the DOW stocks were in I mentioned earlier, putting them very close to their 50 bar average.

 % count new highs/new lows over 250 minutes. I'm a bit surprised to see 250 minute new lows at more then half the Dow.

 5 min % stocks above/below their 5 min 50-bar average, the trend speaks for itself.

And the advance/ decline ratio for the Dow, again, speaks for itself.

Wall Street Never Fails

In my last update on the market posted at 2:23 pm, I said, "The SPY and the bearish ascending wedge mentioned earlier. I'm a little surprised we didn't see an upside breakout before the downside break down."


Guess what?
15 minutes after I wrote that, the market did it. That is how predictable these market reversals have become. For new members, the reason they do this is simple. Technical analysis has taught us that an ascending wedge like the one above, "should" break down. When you get a breakout above the wedge it's considered by technical traders, a failed pattern. TA also has taught traders that they should reverse position on a failed pattern, that means they would have gone short on the break of the wedge, it's what they expected, but when a breakout above the wedge occurs, it's a failed pattern, they should cover their short and go long. There's several different ways the market makes money off this scenario, but what's important is that longs were trapped at higher prices and when the market fell again, they're forced to take their loss, which increases supply in the market and lowers price, it literally kick starts the move down. This scenario plays out in all kinds of different patterns every day, both on bullish and bearish moves. Just be aware of this, it happens too frequently not to be.

USO Take

The Syrian Crisis is emerging as the biggest problem in MENA right now. It appears the MB may be operating there, although there are a contingent of religious minorities that would not welcome their presence. Assad made a huge mistake in promising reforms and not delivering. He made a worse mistake in escalating the violence and firing on mourners at funerals. The Syrian people weren't like the other MENA revolutions, they weren't calling for Assad to step down, they just wanted to see the reforms he promised, but that's changing. When you're friends and family have been killed by Syrian security forces, it's reasonable to expect sentiment toward Assad to change.

If Syria falls, and who knows what replaces it, this will open a door for the Israelis should they decide to make a run at Iran. The Iron Dome the Israelis deployed is not only stopping Katyusha rockets, it's stopping mortars as well! So the Israelis have just changed the balance and calculations for would be attackers. Syria right now is becoming the biggest, geopolitical card in the game and that should effect oil, right?

However we did observe some interesting things as the Egyptian crisis deepened, oil didn't respond. The reason? This is my opinion, but before Egypt erupted there wasn't an accumulated position in USO, it was actually moving in to a down cycle, so that needed to be changed and the locals needed to accumulate which meant suppressing prices.

I have a feeling, although it's speculation, this is what we are seeing now, smart money wants to accumulate a bigger position before the resistance zone is taken out and all the retail traders pour in to chase the mark up period.

 Here's the daily USO chart and the resistance zone we are at right now.

 Here's an example run trying to break resistance, notice how it was distributed quickly so it would fails and prices would not break through, starting the mark up cycle.

The red box is the last significant accumulation period, so it's probably time to restock but the chart also shows that USO appears to be in good shape otherwise.

I'd set an alert for a breakout of USO and be quick to move on it with a tight stop, if the breakout is real, the stop shouldn't get hit. One thing you should know, oil responds intensely to anything revolving around Israel even though they are not an oil producer.

Market Update

Last night in Afterhours there was some odd trading activity, such as the IWM being bid up 10% right after the close, those trades were cancelled, but they were on huge volume and happened very quickly, some sort of algo trade. There were a few others too that saw similar action, TNA was one. In any case, I see stuff like that in AH and it makes me suspicious because of AH experiences I've had.

I use to set an ask in after hours , especially if there weren't a bunch of trade in front of me in light volume issues, that would be 10% or so above the close. Once in awhile I catch a few rookies. I did this once with a bio-tech that was supposed to get an FDA letter the next morning regarding a drug they had submitted. A buddy I use to trade with called me and told me his shares got hit ( he was about 5% above the close), then half of mine were taken at 10% above the close. So I watched totalview and saw bids being flashed for 5 and 10k blocks, they didn't take the other half of my shares, so I lowered my ask to 7% above the close, sure enough, they were gobbled up. Before you knew it, afterhours was buzzing in this relatively small stock. Retail saw the actions and figured there was a leak and the FDA letter would be an approval. Before you knew it, the issue was trading solidly 10% higher in AH, but those 5-10k bids kept flashing on and off, they didn't hold for more then a few seconds and then disappeared.

The next morning the FDA letter came in, basically it wasn't a rejection, but said they needed more clinical data trials and the stock fell 50% that morning. There was a leak alright, but smart money wasn't there to buy, they were there to sell and the frenzy they created by hitting a few thousand shares at 5-10% above the close along with the phantom bids got retail going nuts buying up any offer. This was before algos were as prevelent as they are today so things didn't happen as fast, but anomalies in after hours always make me suspicious.

Any way, here's what we look like in the market right now.

 DIA 1 min

 DIA 5 min

 QQQ 1 min

 QQQ 5 min

 The SPY and the bearish ascending wedge mentioned earlier. I'm a little surprised we didn't see an upside breakout before the downside break down.

 SPY 1 min


SPY 5 min

AXK (long)

There are quite a few stocks in Diagnostic Substances making some pretty nice moves yesterday and today. AXK is one you may want to set an alert on for a sympathy play.

Out of the 25 stocks in this sub-sector, there are very few with any sort of volume, so while there are some nice looking charts, I can't feature a stock that trades 10,000 shares a day. AXK is typically above 100k on very light days, well over a a million on heavier days. It's been setting up in a nice triangle and is close to resistance/breakout level. I'd set an alert for a move above $4.10-$4.15. Depending on your risk tolerance, you can put a stop just under $4 or give it a little more room. Any double digit gains in a matter of a day or two, I'd book at least a portion of with a trailing stop on the rest. The price pattern itself suggests a target of $6.25 or so.

Thumbing Through the Dow

20 of 30 Dow Stocks are in the green, 10 in the red. Of the 20 in the green, there are approximately 13 that show gains that are at or above the Dow's gain for today. Of those 13, 8 have spent the majority of the day moving laterally or are losing ground, not up with the average, their gains came from the open. That leaves about 5 stocks moving up.

I'm setting up the DOW for a breadth scan as well.

SPY

Early trade in the SPY has continued to tighten up in the channel, not forming a bearish ascending wedge

 
The DIA is off on its own right now with mediocre gains in the S&P. The NASDAQ 100 is pretty much flat. Usually the averages move together for the most part, the NASDAQ's behavior is noteworthy as is the wedge in the SPY. 

Considering the Dow's march higher this morning, it's also noteworthy that CAT with good earnings this a.m. is flat after the opening gap.

GOOG Swing Trade

April 26th GOOG started a cycle up, check this post. For those Swing trading this one, it's still on track and no warning signs yet. If you have the Trend Channel, I'd set it to hourly and use that as a stop, otherwise a 20 -30 bar m.a. (depending on how much room you want to give it) should work well on a 60 min chart.

Chicago PMI, Another Miss @ 67.6, down from 70.6

There were some interesting things in there. For the first time I can recall, the priced paid declined. All other metrics were not so hot. Production, new orders, buying policies, capital equipment expenditures and employment all dropped. 


From the survey section the comment seemingly getting the most attention was, "Companies still skittish and intense pressure from boards / stock market. Companies that are very profitable still behaving as if bankruptcy is around the corner."

Libya

Reuters and The London Telegraph are reporting that pro-Gadhafi forces have chased rebels into Tunisia and have engaged Tunisian troops, as well as Libyan forces shelling a Tunisian town, setting fire to local resident's homes. Not a good development, unless you're rooting for a land invasion by the west, then oil could see some real action to the upside.

Unexpected Rate Hike In Russia

Russia was expected to leave rates alone, they didn't, they hiked by 25 basis points. Inflation is running above their target rate of 6-7%! Energy, commodities and food are blamed for run-away inflation, interesting that they acknowledge Energy and Food in rate decisions, as the US tries and succeeds at excluding both. The ECB raised rates this month for the first time in a long time, and Russia completes the BRIC countries all raising rates. Brazil, India and China have raised rates at least 4 times over the last year.

OF course Bernanke says inflation is transitory, yet the BRIC economies have a huge head start on something they think is a real problem. We do have to consider that the Fed has been exporting inflation to these economies through QE, but still, it seems we're behind the curve.

Some Russian plays on energy may make for good investments as well as other Russian companies as the Ruble is sure to gain.

Ever Wonder Why Comex Keeps raising Silver Margins?

Here's another article for you silver bugs that could produce a huge short squeeze in Silver if indeed Comex doesn't have the physical to deliver. Their margin hikes (2 this week I believe) suggest that's a possibility. If this article is somewhat right, a short squeeze could quickly bring silver up to it's historical gold/silver average and then some.

Article HERE

Thursday, April 28, 2011

RIMM just got hit in AH Earnings

I believe trade is halted, the last b/a on my chart shows a little better then a 10% decline. I haven't had a chance to look at the report, it'll be interesting to see if there's contracting margins, uh-um, or rather transitory inflation.

While nowhere near as drastic as th last hour signal in GOOG before earnings, the distribution period on these stocks is getting much tighter. Several quarters ago leaks could be seen (in very obvious cases) a week or so ahead of time, now they're coming down to the wire.

Interestingly, RIMM's 5 min chart looks a lot like the market's

Note that tell-tale lateral trade today with declining 3C readings, until the highs this a.m., there was relative confirmation.

VIX/VXX

Today the VIX posted it's lowest closing price since 6/20/2007 at $14.37. The newer VXX posted it's lowest close in its 2+ year history. Remember, extremes in these two indicators have traditionally been turning points in the market with an inverse correlation, meaning an extreme dip in the VIX would correlate with a top in the market. I've used the VIX since 2000, even after it was reworked. The normal range on the VIX for a rally to reverse would be around 20-25 or so and a bottom over 35. These readings are extreme complacency. The last major signal in the VIX was April 2010 when it hit 15.5 about 2 weeks later the market dropped a little more then 16%, that was the last major correction.

Quick Market Peak

This afternoon move has the looks of short covering to it, I didn't see anything out news wise that would explain it.

 Just to double check my indicators, I'm looking at Worden's Money Stream on a daily of the DIA, I don't even have to draw in the divergence, it's pretty clear.

 Interestingly (MS isn't usually that sensitive on intraday charts) it picked up this negative divergence on a 5 min scale where the worst of it seems to be.

 3C 5 min of DIA

 The Q's daily, again, way off on MS.

 And the 3C Q's 5 min..., note the acceleration downward today.

 MoneyStream on the SPY daily, again, a really ugly leading negative daily divergence.

And the 3C SPY 5 min chart, again accelerating downward as the market moves up.

Suffice it to say, I don't trust this move much.

China's Response

I wrote, I think last night, that China would most likely voice its displeasure with Bernanke's policies and we'd probably see some sign of that in today's Treasury Auction of 7 year notes. Sure enough, the indirect bidders (i.e.-foreign countries) dropped to 39%, compared to the last auction at 49% and an average of 51.5%

I think China just spoke.

Harley Davidson

Take a look at this potential short play. This isn't a trade for someone looking for the quick play, you have to have patience with this one, but it may very well pay off.

I'm looking at the daily chart, 3C tracked the uptrend and confirmed it for nearly a year, at what is similar to a double top, it went negative, meaning distribution at the test of the highs.

 Here we see the top with a VERY well defined support zone. Look at the huge red volume when it broke down through support. It's obvious stops and shorts were all lined up right there. Right now it's corrected through time laterally and is threatening to take out intraday lows.

 For traders who want a tighter stop, this TC has tracked decent size swing moves and you can see where the stop would be. I would position size the trade to take that stop into account in case of a bounce, but this isn't where I see the trade I'd take.

This trend channel tracked the entire trend up and it's turned down, in my experience, stocks don't usually come back from a change in character like this.Th stop is only about $1 higher, but I think well worth it for a trending trade.