Again, from yesterday's post on the PMs
Yesterday GLD's signal was more troublesome being it is longer term,
"The short term charts of SLV and GLD look like a downside correction is coming, at least on an intraday basis. GLD's signal is a bit longer term."
Today's GLD daily chart, down over 2%-remember all of the poor closes I mentioned-these were a piece of the puzzle.
Here's the short term signal, very negative yesterday, the current action is slightly better then inline, there may be a bounce opportunity to enter a position if you so choose, DZZ would be my pick.
The 5 min chart has shown serious trouble in the underlying action, what I mean by underlying is what smart money is doing behind the scenes, something not visible in price action itself, although as mentioned above, we did have some price oriented hints.
The 15 min chart calling a positive divergence/accumulation, again as mentioned before, notice the flat trading range of accumulation. Since a serious problem has developed on the 15 min charts. Yes, I believe CME did not just come up with the margin hike overnight and yes I believe players on Wall Street were alerted to the impending margin increase.
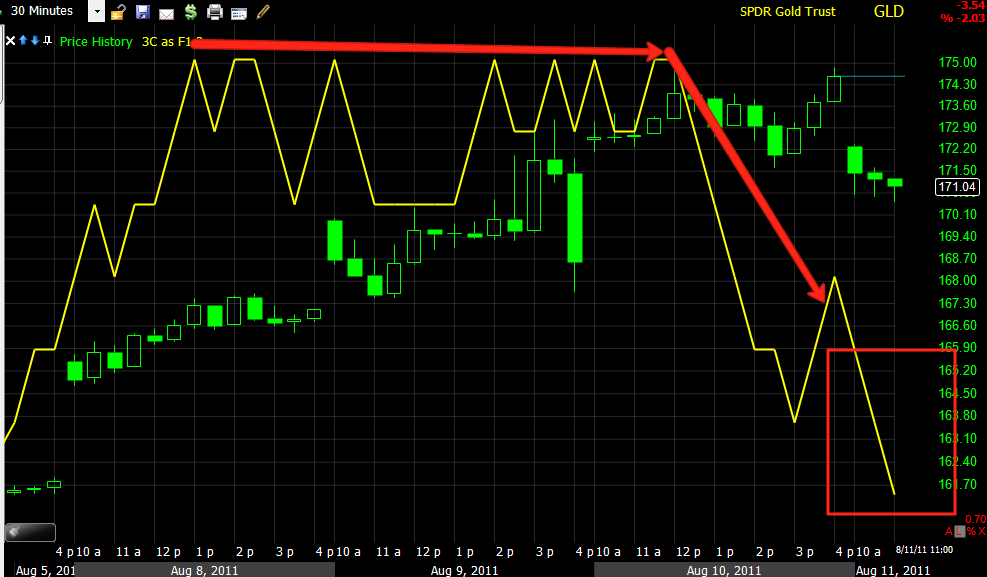
The 30 min chart rarely moves this fast in to a leading negative divergence, there must have been some serious distribution.
The daily chart showed us the accumulation that sent GLD higher from a large consolidation area, since then the daily chart has deteriorated badly, not keeping pace with price and forming a negative divergence , indicative of distribution.


 | Theme by Thur
No comments:
Post a Comment