Or something like that...
So, obviously my compulsive side came out a little about this late day divergence on the 1/5 min charts; so I fired up StockFinder which has a longer historical base and looked at our current divergences and looked back at some historical divergences on the 5 min chart that were positive in an otherwise negative 3C trend. Most of what I found was from the early August downtrend or the August Op-Ex week fall in the markets and what I found was, maybe I'm a little too paranoid sometimes and that you always have to keep the bigger picture in mind when focusing in on a tight perspective.
Here are the charts...
Here's the current DIA chart and 1 min positive divergence, I found a similar one on the Wednesday of Op-Ex week, the next day the market fell nearly 4 % (the divergence is at the white arrow, the next day is in either a red or green box depending on if it was up or down-obviously down in this case).
Here's the current 5 min positive divergence all the way to the right, I also found that in historical perspective, this divergence is in the middle of one of the worst negative leading divergences we have seen since the market bottomed around Aug. 8th; that has to be taken in to consideration.
Here's the historical peak from the start of the August downtrend. You can see (5) 5 minute positive divergences, all saw the next day down.
Here's the current IWM 1 min positive divergence from this afternoon, and it's in the middle of the worst negative leading divergence on the chart.
This is around the start of the August downtrend, Aug 1/2 being the nasty part of its start. There were (2) 5 min positive divergences, the first led to a flat day on the next day, the second gapped down and finished about unchanged, but I don't think the 5 min positive from the day before had much to do with the finish, so the important part is it still gapped down. Then a very positive 5 min divergence on Aug 1st, leading positive in fact, and then the start of one of the worst days down following that positive divergence.
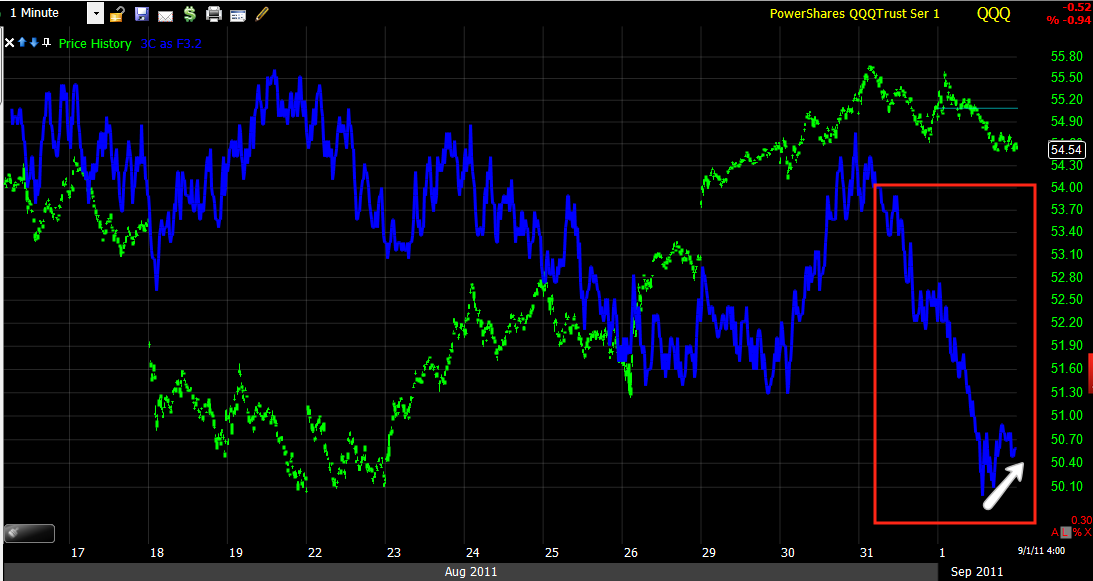
Here's the QQQ's current 1 min positive divergence from today, also in the worst negative leading divergence on the chart.
Here's today's late day 5 min positive divergence...
We see a very strong 5 min positive divergence in leading position on Aug. 1st and then a nasty day down on August 2nd.
Here's the SPY's current 1 min positive divergence
Here's today's 5 min positive divergence, also in a leading negative divergence and barely visible on the historical chart.
Rolling the history back a bit, we see 2 5 min positives that led to a flat day and an up day, the second was the up day, but that was a quite large 5 min positive. We also see 2 that led to down days.
So, I think there's not a lot of historical precedent to get too paranoid-(sorry, it's my nature). Those divergences could very well have simply led to the flat range at the end of the day and even if they led to a gap up, I think putting them in context by looking at the historical charts says what I said earlier, in the big picture, they are kind of irrelevant.


No comments:
Post a Comment