Recently we hve been taking trades that are market directional because there isn't a trend that will allow for rotation and stock picking, but I just said this week, the first place that may be an exception would be financials, especially those with European exposure.
Mentioned on Monday, BLK which if you had shorted at any point during Monday or since, you'd already be at a profit.
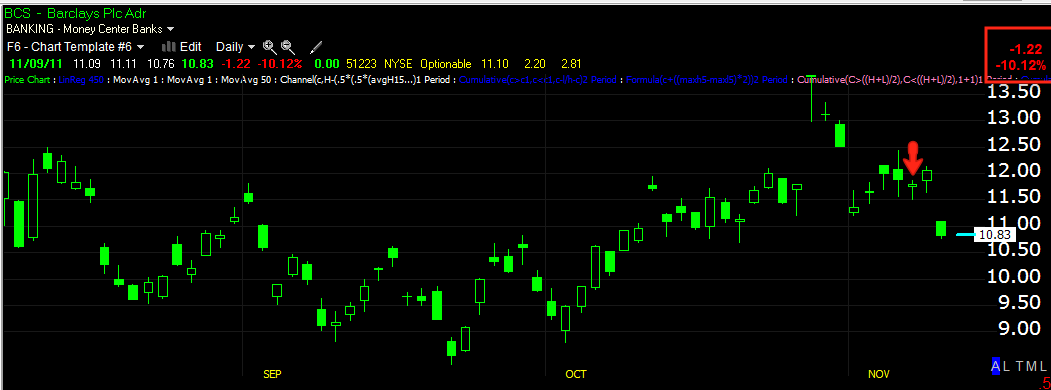
Also on Monday, Barclays, BCS , again, having shorted it at any point since then and including at the time I called this a sucker's rally, you would be at a profit today as it is down over 10%.
Let's take a look.
Barclays-BCS
This is the weekly chart, BCS seems to be starting its next leg down and they do have exposure to toxic EU debt.
The red arrow is when BCS was featured, at a 10+% loss today, I think that the drop in financials signals that something much worse then a margin hike on Italian bonds was brewing. We are so far behind the information curve and Germany and France's plans to rid the EU of all PIGS seems to be a lot further along the road then the initial articles suggest, this may in fact be the reason we have been seeing what I have called some of the worst 3C readings I have ever seen. It just so happens that today, the EU let the cat out of the bag.
BCS hourly chart-there's been great confirmation on the way down, the fact that BCS was in a leading negative divergence during the rally tells me something, sucker's rally indeed, just a lot bigger then we may have originally thought.
BlackRock- BLK
BLK is near the neckline of a multi-year top, the implied downside once the neckline is broken is about, you won't believe this, but about 100 points lower.
BLK recent 5 min 3C action in to the recent bear flag rally, it looks like it was sold/shorted the entire time, the very reason bear flags exist.
Here is FAZ, which I have held on to in the model portfolio. There has been an outstanding positive divergence on the long term 30 min hart, leading positive in fact. I don't plan on letting go of this position any time soon.
FAZ 15 min chart shows a very positive divergence in to the recent bear flag and before, it's now leading positive in a single day.
Jefferies-JEF
Despite what "seems" like JEF cleaning up their exposure, remember we are in a time when no one trusts anyone about their exposures. The long term 6 day chart of JEF implies big problems ahead.
Again, an hourly hart with near perfect downside confirmation, which is excellent for the reliability of divergent signals, look at the performance of 3C as JEF put in an island top.
We have confirmation on the 30 min chart too and judging by 3C today as well as the 8+% loss, I think it is safe to say the market still has doubts about their exposure to the EU.
On a shorter timeframe, JEF didn't participate very much in the recent run up, it was negative at the top and the short term 2 min chart is leading negative today.
I for one am glad to have exposure on the short side to financials.


No comments:
Post a Comment