Here's the big picture again and the typical "new" bullish descending wedge behavior (unlike what Technical Analysis has defined this pattern to be for nearly a century). As you may recall, these bullish wedges "use" to break out at the apex of the wedge, you can see a false breakout in yellow-I also suspect that is the area of resistance that will mark a stage 2 breakout.
The recent bullish ascending wedge consolidation may have had a little shakeout below the lower trendline, but a daily bullish reversal hammer is forming, if you like this trade but haven't had an opportunity to get in to it, today may be that chance.
Since we first noted a bullish change in character, I have said, all I care about is that URRE keeps a generally rounding bottom shape as you can see by the 22 day moving average and that volume pick up on the right side of the pattern, so I'm satisfied with URRE's price performance thus far as it was what I was looking for long before the rounding pattern was even present.
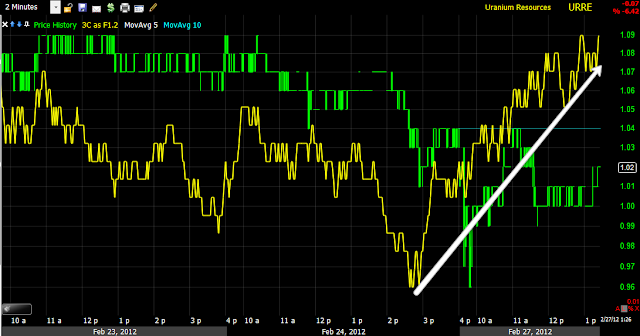
Short term 1 min chart seems to show a positive divergence today (which is forming a bullish hammer reversal candle).
The 5 min chart is also showing positive divergences.
And the 15 min chart looks good overall.
As does the hourly chart.
I'd sum up URRE as so far so good and today looks like a decent area to add or initiate if you like the trade long.
Is interest rates about to start going up?
-
Yes, I know - it does not make any sense - FED is about to cut
rates...but....real world interest rates are not always what FED wants it
to be.
6 years ago


No comments:
Post a Comment