Honestly, I expected this move in AAPL toward the mid to later half of last week, better late then never and a few days off I can live with.
Oh, earlier I said there were two components to a head fake move, there are 3, 1) the move itself which must break an important pattern, support / resistance or a new high/low. 2) The underlying action in 3C and other indicators should show negative divergences, weakness in to price strength just like the old adage "sell in to strength" and finally there needs to be confirmation which is price moving back below the important breakout area. However by the time we get to step 2), we can often dig up a trade just like with GLD. If we waited for step 3) we would have made ZERO in GLD. Whether AAPL will be the most sensible trade or not remains to be seen, it is the bellwether status that had me focussed on AAPL.
Just using the GLD false breakout/head fake, reversal or shakeout; as an example, it was this post on 2/21/2012 that set the entire GLD trade idea in to motion.
Specifically, it was this chart...
From the longer term analysis of GLD and what was going on in the underlying trade, I posted the GLD probable head fake trade before it even began. This is what I said under this chart on 2/21,
" Here's a close view of the Apex of the triangle and rally off the lows that broke support right to the apex. A trading range has been established, this is a set up for T.A. traders, a breakout from the range is supposed to be bought, but look at the first break to a new high around early Feb. The breakout volume was low, the failure to hold it was on increased volume, longs were stopped out. Now we have another possible breakout of the range and again volume is low. To entice longs to buy this breakout, it will have to make a new high and surpass the former breakout to remove any lingering doubts."
Here's what the underlying action in GLD looked like at the time...
As of 2/21, negative before the breakout.
2/21 negative...
The breakout....
MACD and RSI both negative on the breakout...
The red trendline is the breakout trend line, after the breakout, 3C got progressively worse until GLD dropped -5.3% in one day and apparently on no news. I'm not (at this point) saying AAPL is a trade, the point is it just can happen so fast that sometimes other indicators give more timely confirmation then the actual price move, however, that is not as important in this case as we are looking for a total market reversal. It should be noted though that the intensity of the GLD breakdown took out 24 days 922 days in a typical trading month) of longs in 1 day. It's the head fake component that makes these such dangerous reversals.
Here's what the closing action looked like in AAPL today...
Daily MACD is in a nice confirmation trend at the green arrow, it is divergent at the red arrow. Note volume didn't do much of anything today for such an important breakout.
In fact, even on an intraday basis as different levels (the former closing high, the former intraday high, today's new intraday high) were broken to the upside, volume was muted.
Today's hourly price and volume in the white boxes. The GLD volume on the breakout wasn't impressive either, but it was at least on increasing volume, today AAPL's volume diminished.
RSI uptrend confirmation and RSI breakout non-confirmation or a negative divergence and I used a fast setting to give it the benefit of the doubt.
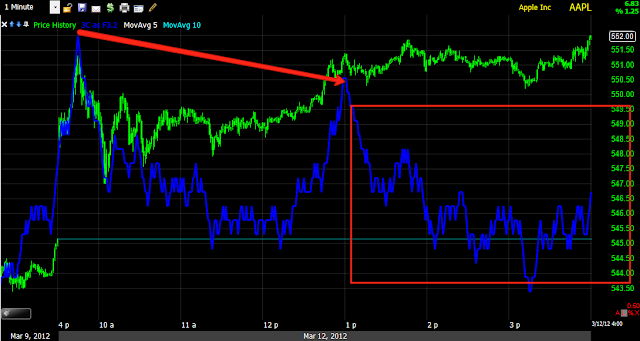
Below is today's intraday 3C chart, remember earlier I thought maybe 3C may move higher or at leat to the same level as the open at the right side of the red arrow upon AAPL breaking above the opening highs, that didn't happen, in fact it got worse.
On a slightly longer chart and longer timeframe, Monday's head fake move sending AAPL lower was already negatively divergence, which simply suggests that smart money was already in the trade short as their positions are large and take more time to put on without moving the market against them. I used yellow arrows to show 3C/price trend confirmation, this simply means 3C is moving with price and there are no divergences; that didn't last long. Again, it take Wall Street more time to put on their large positions, otherwise they move price against their position. Usually a important breakout will give them enough liquidity to get their trades off.
On the 5 min chart, again, 3C was already negative before Monday's head fake move. The positive divergence here is small, it's enough I suppose to get the bounce moving, but it doesn't look like the idea was to buy low/sell high and then move to a short position.
The 15 min chart also shows 3C negative before Monday's head fake move in the yellow box. The yellow arrows show early confirmation in the bounce, again it didn't last long as the red box around 3C represents a leading negative divergence. In orange I put boxes around 3C at two relative levels, one around 2/27 and one today. I put light blue boxes around corresponding price levels, this is to show you how much lower 3C is now at significantly higher prices, this is the essence of a negative divergence.


No comments:
Post a Comment