The DIA appears to be one of the weaker underlying averages, in the yellow box is the triangle I mentioned that has barely broken out, there's a leading negative divergence on this 1 min chart and there have been no positives even intraday.
Again the 2 min chart confirms the same, DIA at the green arrows is not a positive divergence, just in line with price, but since the breakout of the triangle, a leading negative divergence is in place.
The 5 min chart looks even worse.
ES hasn't done much in the way of divergences most of the day, but there is what looks to be a leading negative setting up there, if it turns down shortly it will be confirmed and worse.
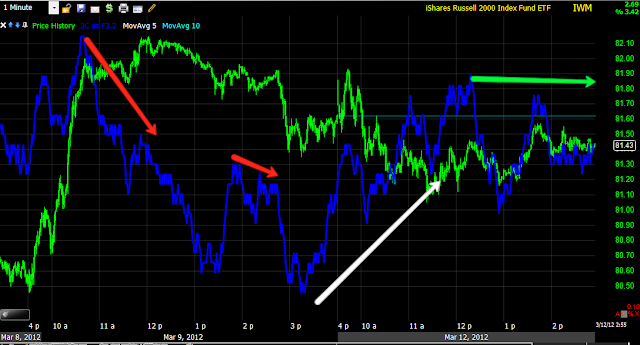
The IWM is the one average that looks like it wants to try for higher prices, there's a positive divergence that is fairly large for an intraday chart.
The same on the 2 min, recently there's been some negative activity, but I would guess that may be a consolidation comparing it to the preceding positive divergence, again intraday.
While not as strong, the 5 min chart also shows a positive divergence, it looks like the IWM wants to try to catch up to the other averages.
The QQQ is somewhat negative here on the 1 min, that leading negative in the red box could be part of a consolidation, we'll have to see if it dips even lower.
The 2 min chart is showing what I hoped to see, underlying weakness.
And the same on the 5 min.
The SPY saw a small intraday positive earlier, right now it's in line with price on an intraday basis, longer term even on this chart, it's still in a leading negative position.
The 2 min chart is about the same, except the leading negative and the longer chart is more bearish.
Essentially some intraday positive divergences that move price intraday, but the bigger picture is still weakness in to any gains in price.
The 5 min chart is almost exactly the same, yet again because it's a longer chart, it is more bearish.
AAPL
You know I've been looking for a head fake move in AAPL, there are two components, 1) we need a breakout above an obvious level that gets buyers (retail) buying. 2) We need to see underlying weakness in to the price advance, same thing as the GLD set up.
Earlier I thought maybe the point in which the red arrow is toughing on the right may move higher with a move higher in AAPL, it didn't, in fact things have gone downhill since then.
The 2 min chart shows exactly what I thought we'd see and why I said I was looking for a head fake break out and not just a breakout, the underlying weakness in to the price advance is what gives away the head fake move.
Look at the divergence on the 5 min chart since AAPL moved north of morning resistance, this is exactly what I thought we'd see.
Is interest rates about to start going up?
-
Yes, I know - it does not make any sense - FED is about to cut
rates...but....real world interest rates are not always what FED wants it
to be.
6 years ago


No comments:
Post a Comment