Yesterday I featured BAC and how it looked like it was starting to break down for at least a pullback as BAC seems to be in stage 2 mark up. The failure to maintain the mark up stage would have serious consequences for BAC and Paulson might not feel as crappy as he does now for selling his shares at $5.00
Here's what we were looking at....
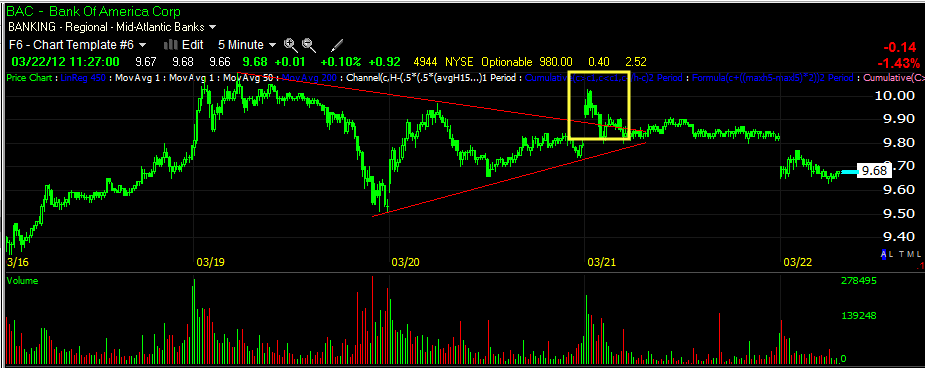
First this highly visible triangle and a small head fake move outside of the triangle, this would be considered a bullish continuation consolidation by technical traders and they bit on the start of the breakout as you can see by volume, today they are at a loss. I do question whether that is the extent of the head fake.
The daily BB's and this particular price candle outside of the BBs.
As well as a recent break of the Trend Channel, suggesting this recent parabolic leg is ending.
The 30 min chart was leading negative yesterday early on when we looked at BAC, it has gotten worse, in fact...
The weakness has now spread to the 60 min chart.
Here's the intraday movement (positive and negative divergences in BAC, this chart suggests we may see some price strength in BAC, that would be welcomed to short in to. I'll set some price alerts and if we get some price strength we'll take a look and see if it is in to distribution, that would make for a nice potential entry.
There is a tweezer top in the red box, that should hold as resistance in case the move is beyond a gap fill.
You may want to set some price alerts as well if you are interested in the trade.


 | Theme by Thur
No comments:
Post a Comment