It's amazing how many little thing move the market. I'm a believer in looking everywhere for the pieces of the puzzle. My second proprietary indicator ever created (the Trend Channel was the first), 3C, is a reminder of this philosophy, 3C="Compare, Compare, Compare", I use 3C that way in looking at multiple timeframes and I look at the market that way as well, you never know where the market is going to give you a very profitable "tell".
First, commodities vs the SPX
You can see relative strength is pretty good in commodities today vs the SPX, although it's starting to fade a bit (+1.62%)GLD is part of this as we have expected a bounce here, and the recent trade action may be part of the reason commodities are starting to fade a little intraday.
Yesterday I was asked by a member about USO, my reply was short term bounce, longer term (as of now), I remain bearish and more so in Brent crude vs WTI (USO for WTI, BNO for Brent). I think Brent is at much greater event risk via Iran then WTI (West Texas Intermediate)
SLV has contributed to commodities advance today
And copper which is also fading off a bit as the day wears on.
Rates/Yields warned on the 21st as they went negative vs the SPX and the SPX dropped (orange arrow), yesterday they were in line with the market and thus probably part of the dull market action. Today yields are rolling over, positing another negative divergence vs the SPX.
FXA, the $AUD (Australian Dollar) which is part of the carry trade which is being unwound (not good for the market), posted a positive divergence at the white arrow this morning. Note the previous negative divergence on the 20/21st that sent the market gapping down on the 22nd. Today the $AUD looks like it is hitting resistance so it will not be as supportive of the market.
Here's the longer term trend in the AUD vs the SPX, this is part of the carry trade being unwound, the carry trade is what hedge funds and institutions use to finance risk on trades. The fact they are closing it out is not good for the market.
Here's the Dollar, usually I'd use the Euro as it has a 50% weighting in the Dollar Index, but there' been a bit of a disconnect there so why not go right to the source. The $USD has an inverse relationship with just about every risk asset including commodities and equities. The $USD in orange (vs the SPX in green) shows yesterday dollar weakness sent the market a bit higher (arrows to the far left), then some dollar strength sent the market back down. This a.m. and late yesterday, the dollar fell and equities having hit support bounced from there. Right now there dollar has moved up a little and is at some resistance, I suspect it will break higher pressuring the market.
Credit leads, equities follow. Here's High Yield Corporate Credit, it has been selling off since yesterday, it moved up a bit with the SPX earlier today, but refuses to move any further leaving it at a negative divergence, suggesting the price strength in the market today is likely being used to sell in to.
The longer term picture of Corp. Credit, it has been in a downtrend, the yellow area is where I expected the market to make a head fake move up, I said the stronger the better as it will trap more longs and create a snowball downside effect. Credit is not going any higher as you can see and starting to sell off again, the effect on equities is clear.
XLK/Technology was leading the market most of yesterday, remember me saying the market is AAPL, that changed today as momentum in Tech relative to the SPY and yesterday is fading.
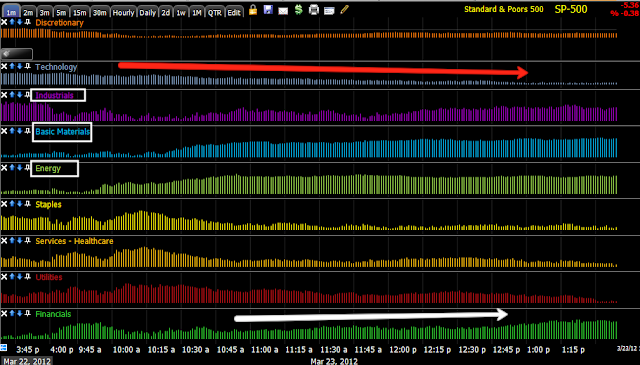
Financials came in to rotation today to take up the slack for tech for the moment.
In today's sector rotation it is clear Financials came in to rotation while tech is falling out.
Here's the latest ES chart..
The negative divergence in ES has halted the market's advance and the market is looking like it wants to roll over.


No comments:
Post a Comment