This one looks exceptionally bad.
At first MSFT doesn't look that bad, RSI is a bit negative and it seems to be in a small top.
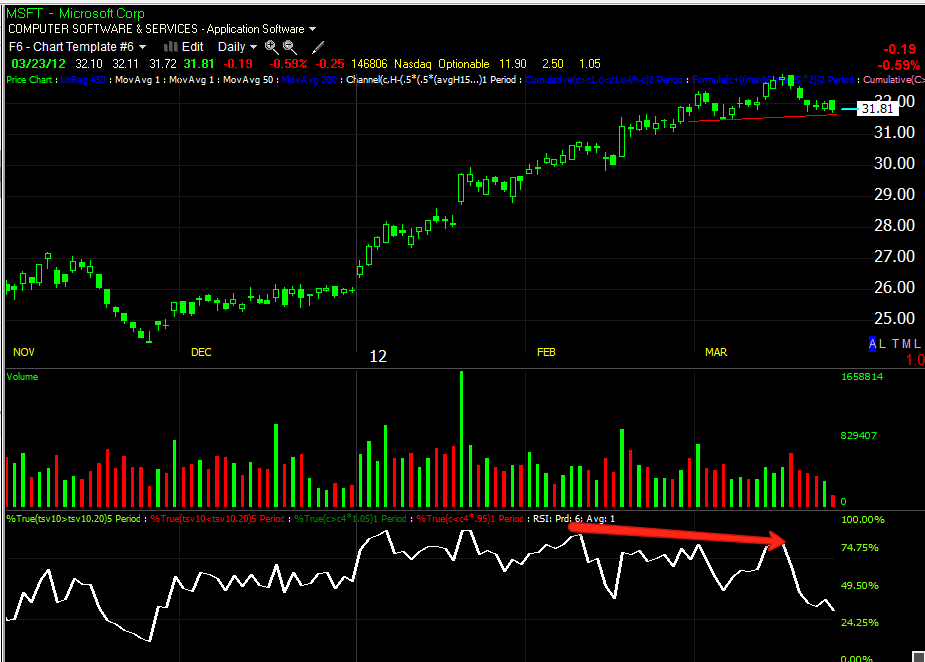
On an hourly chart, the H&S top is a bit more clear, there also looks to be a distribution day at the red arrow on heavy volume.
The Bollinger Bands are turning lateral and starting to narrow, the short MACD is definitely negative.
The Trend Channel has held the entire move up, it has just been broken and is starting to turn.
The hourly chart shows MSFT in line and then a large negative divergence. MSFT is a large golding so it take time to distribute shares without moving the market against institutional positions, they want to sell in to higher prices, not lower ones so they feed a little out at a time. However at this point, the leading negative divergence is so deep, it is lower then where the rally began.
The same action is confirmed in the 30 min chart.
At the top, the 5 min chart also shows smart money selling in to strength.
The same on the 2 min chart.
The entry is where it gets tricky. Edwards and McGee (the standard of technical analysis) would say to short MSFT on a break of the neckline or once in a while, there's a bounce back to the neckline that fails and that is a second place to short it. Our experience has been once the neckline breaks (and this is the case with almost all breaks of support on almost all timeframes), there is a sharp bounce/shakeout and many technical traders are stopped out using conventional TA. I look for that volatility bounce and as it starts to turn back down, short it there while it's still rather high, the concept is to short in to strength.
There's one caveat, market direction. If by the time MSFT breaks the neckline the market is in serious decline, having broken the 20 day moving average for the major averages, the chances of the volatility bounce go down as the majority of stocks will follow the market. You might want to set some alerts and you can always check in with me via email as to where we stand, but the 60 min chart looks so bad here, I suspect MSFT is going to see much more downside volatility then it has in years.


No comments:
Post a Comment