As an aside, I use to work right across the Street from a large Kimberly Clark Facility, from talking to employees at lunch break, it was poorly run and they predicted its demise, sure enough a year later they closed the facility, but that's just an aside.
KMB seems to be working on a decent size top, perhaps a complex H&S top, I'd have to do the volume analysis to determine exactly what, but a top nonetheless.
This is one of the rare stocks that leaves gaps open, like the island top, which was the absolute top (highs) and more recently a bear flag gap down formation, so I would say chances are excellent this gap in left unfilled as well.
The daily Money Stream needs no annotations, the divergence here is very clear and bearish for KMB.
A 30 min chart encompasses all of the top, from the last accumulation stage to the Island top breaking down and the current bear flag formation to the right.
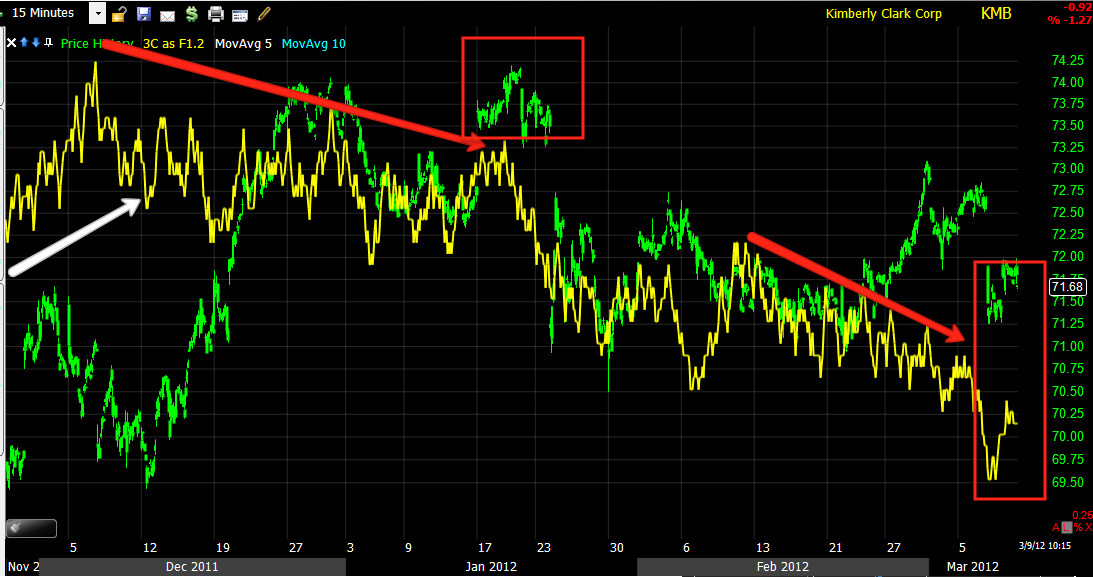
The 15 min chart shows more detail, especially at the Island top, recent trade in February had no 3C support at all and has since gapped down on a failed bounce/rally.
On a 5 min chart you can see clearly where the rally attempt failed, note it ended with a parabolic move which at the time would have looked very bullish, price is deceiving. The bounce to form the bear flag isn't looking very healthy either.

Here's a 1 min chart of the bear flag, note the deterioration in to the recent attempt to rally.
And a close up of the 1 min. I would guess KMB will start a new leg down soon from this small bear flag. However KMB is not a very high Beta stock so it is probably best played with options and probably on a short term basis until the top finishes forming and truly breaks.


 | Theme by Thur
No comments:
Post a Comment