Starting with the Capital Context ES and VIX models...
Make sure to look at the time stamp, this is about 20 mins. delayed and ES trades 24 hours. The ES Model is weaker then actual ES, which is what I would expect, so no surprises there.
This VIX model is from the start of today's trade, the VIX is much lower then the implied level of their model, again not surprising considering the market is trying to move up with the EUR/USD in collapse, like I said, I can think of only 1 good reason it would try to do that.
As for our own models that are more specific...
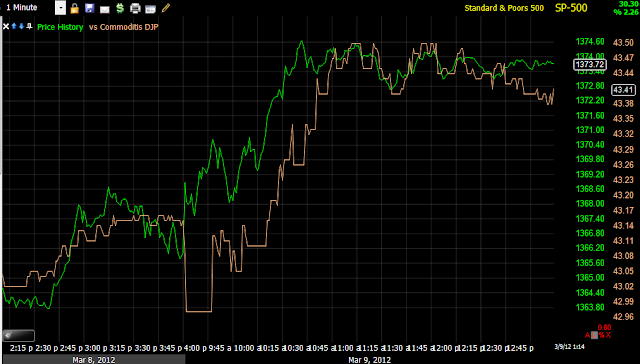
This is very interesting, not only is the market up against its normal EUR/USD correlation, but commodities broadly as well today, this is aberrant behavior especially for commodities.
Commodities vs the SPX (green line) since the bounce, commodities clearly are less excited and longer term at a much, much larger dislocation since December. The point of looking at this is that commodities are a risk asset and when the market is truly in a real risk on mode, they should rally with equities (which besides everything else I've shown you, the market Breadth post from 2 nights ago clearly shows equities falling apart individually, that is not apparent in looking at the averages alone, only when you look at internal breadth).
The normal Euro/Market positive correlation is absolutely smashed today, meaning today's move is a rare and strange move, again I think you understand why I don't find this to be strange, but expected.
Longer term, divergences between the Euro and the SPX have sent the SPX lower, they should rally together for the most part unless something is very whacky in the currency pairs which makes the $USD and Euro travel in the same direction which they almost never do and are not doing today.
This is what the divergence in the Euro/SPX from above would have looked like at the time before the SPX dropped.
High Yield Corporate Credit should not only be in sync on a risk on move, it should lead equities, here it is lagging badly on the bounce.
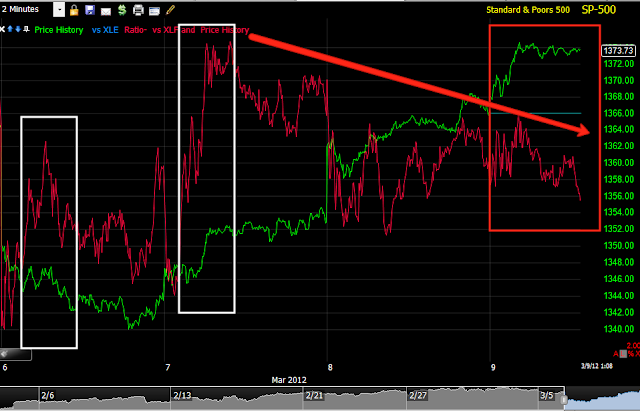
This is the Energy complex vs the SPX, in white Energy had more positive momentum and led the market higher, now it is negatively divergent with the market.
Financials are in sync today with the market and have been pretty much that way throughout the bounce, but remember the Financial/Tech post from last night, underlying action is very bad.
Technology led the market early in the bounce, today it is nearly running opposite showing a lot of weakness.
The findings from the 3 major sectors above (Energy, Tech and Financials) can all be seen and confirmed in today's sector rotation, Financials at the bottom have the best relative performance vs the SPX, Energy and Tech have some of the worst performance. Utilities are also showing strong performance, which is a bit odd as they are a defensive sector.
As for commodities strange behavior today (and strange behavior is part of what I was looking and hoping to find this week), lets take a look at a few major commodities.
As I mentioned above, the only way commodity strength today would make sense with the Euro down (because if the Euro is down, the dollar is up and the Euro/$USD pair is the biggest influence on the dollar Index-out of the dozens of pairs, it accounts for 50% of the DI) would be if there were a major FX upheaval that saw the Euro and Dollar trading together which I don't think I've ever sen, but just for confirmation, I use the dollar in these comparisons.
The basic concept to understand is that most commodities are traded the world over in $US Dollars, therefore when they dollar is weak, commodity prices must rise to make up for it, when the dollar is strong, commodity prices fall. Today the dollar and commodities are strong, aberrant behavior.
This is a multi year chart of USO with the $US Dollar in red and you can see the inverse relationship I described above, when the dollar is up, oil falls, when the dollar is down, oil rises.
Now look at the behavior today, even yesterday you can see a hint of the inverse relationship at 3 p.m., today they are traveling in sync.
Here is USO but with the Euro as the comparison symbol, you can see (because the Euro trades opposite the dollar generally) the positive correlation, if the Euro is up, oil is up, if the Euro is down, oil is down, NOT TODAY.
Here's copper vs the Dollar with the typical inverse relationship to the left and a totally whacked out correlation today. It's as if these assets are being moved against all odds, against all correlations or you might say they are being manipulated higher.
GLD vs the dollar, everything is normal (inverse relationship) until today.
The same with Silver
The same with Steel.
Like I said, it looks like these assets are being artificially manipulated higher to support the averages.
Is interest rates about to start going up?
-
Yes, I know - it does not make any sense - FED is about to cut
rates...but....real world interest rates are not always what FED wants it
to be.
6 years ago


No comments:
Post a Comment