I'm just going to post these charts because I want to get to AMZN and AAPL where I think something is up. Just take a look at the time frames and the intraday vs the longer trend on the same timeframe.
DIA 1 min
DIA 2 min
DIA 2 min expanded view, non confirmation, leading lower

ES, this may be a new leading 3C low
IWM 1 min non confirmation
IWM 2 min intraday
IWM 5 min
Weakness spreading to the 15 min chart, leading negative in 1 day
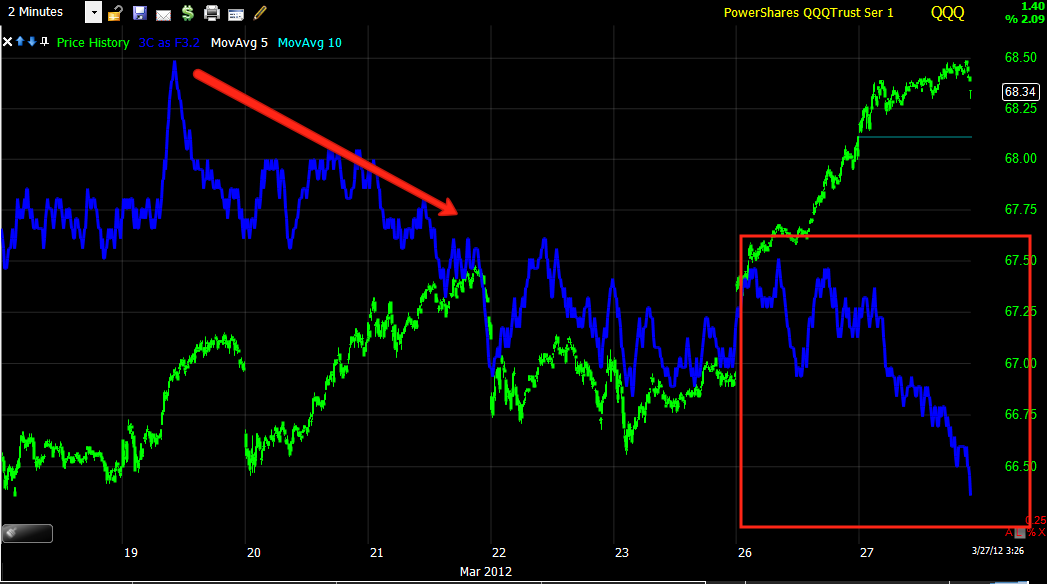
QQQ 2 min intraday
QQQ 2 min longer trend
QQQ 2 min even longer trend
QQQ 5 min weakness from the shorter charts
QQQ 15 min leading negative in a day
SPY 1 min intraday near new leading lows
SPY 2 min
SPY 5 min weakness filtering through longer timeframes
SPY 5 min expanded view/trend
SPY 15 min


 | Theme by Thur
No comments:
Post a Comment