Commodities
Yesterday I pointed out that commodities were becoming dislocated on an intraday basis with the SPX as afternoon trade picked up in the SPX. Commodities are moving lower today and still divergent with the SPX (leading negative).

For reference, this is commods vs the SPX since about December, although in this period they tracked fairly well, recently the divergence between the two "risk on" assets has diverged.
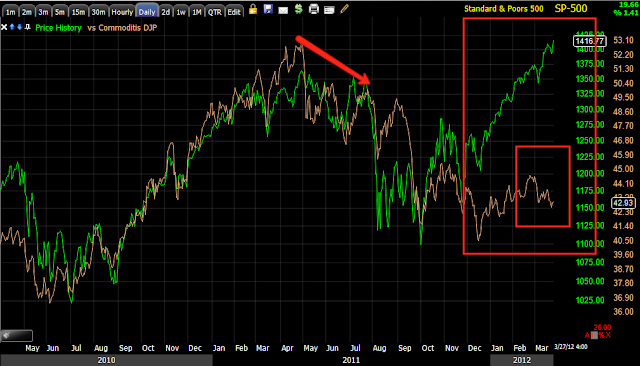
Longer term since about the time QE2 was announced, commodities tracked well as a risk asset with the XPT until the 2011 "top" area, commodities lost ground much quicker then the SPX and were fully negatively divergent by the end of July when the SPX plunged 20%. Since about the October lows, Commodities have done almost nothing relative to the SPX, this is a red flag and represents trouble in China which we identified several weeks before the first indications in Chines PMI (both manufacturing and services) declined. It may be time to start looking at FXP for another trade.
USO today is only up about .10%, last week I said I was very short term bullish for a bounce in USO, but longer term negative, this is certainly impacting commodity performance today. USO lagged yesterday as well at about a .50% gain.
GLD as you know last week I thought would see a short term bounce, today it down .43% after having the biggest move up yesterday in 2 months.
SLV is tracking GLD for the most part
Copper is also weak today and forming what as of now looks to be a Harami downside reversal pattern, if this holds in to the close, there would need to be a down day tomorrow to confirm, but as you know Copper has some correlation to the market overall.
The Dow Jones Steel Index is looking a bit like a bear flag here with momentum obviously running out with a hanging man posted yesterday and a small shooting star thus far today.
CREDIT
High Yield Credit would be the obvious "risk on' trade, as you can see, credit is selling off today at the intraday lows (Credit leads, equities follow),
HY Credit hasn't made a higher high since Feb. 3rd and recently has moved from lateral trade to the start of a downtrend even as the SPX moves higher, this is a divergence really waiving a red flag.
Last night I went in to Yields a bit, yields can be considered as a sort of magnet for stocks. Yesterday was strange in that yields were declining in the afternoon while the SPX was running, a negative divergence, today there's no ambiguity, yields are crashing here vs the SPX putting in a very negative signal.
A bit longer term look at yields show them rending down, in several instances last week they lead the market lower and moved pretty much in sync, this week they are severely disconnected, this is one of many reasons I believe this move in the SPX is being sold in to and setting the SPX up for a nasty decline.
An even longer chart of the two, note the confirmation in trade in the green arrow areas and the severe divergence of yesterday and today.
Even longer term on a daily chart, yields warned at the 2011 top area and fell off much faster then the SPX, a red flag, shortly after the SPX lost 20% in late July, the dislocation between them now is probably historic.
The $AUD has been a good leading indicator for the market, last night I noted the failure of FXA to make a higher high from the early morning highs, while the SPX (see the corresponding trendlines) moved higher, forming a negative divergence. Today again, that divergence has no ambiguity as the $AUD dropped right on the open .
This is a longer look at the $AUD/SPX, in Feb. the $AD barely made a higher high while the SPX trended higher, lading to a quick sell-off in the market, at this point $AUD has trended even lower posting a much bigger divergence with the market.
Since November, note the confirmation in the $AUD/SPX at the green arrow, that has changed as the $AUD now leads lower. There are many instances on many different timeframes of the $AD acting as a leading indicator for the market.
As for sector rotation on a relative basis, Financials are losing momentum compared to yesterday as they start to move out of rotation, Utilities, a defensive trade have gained ground, Healthcare also defensive looks to be gaining ground certainly way up from yesterday. Energy as you can see has lost ground and looks to be moving out of rotation, while Tech and Discretionary are still maintaining, all on a relative basis, but the market is starting to look dividd between a risk on mode to a defensive mode.
The VIX with a quick Percent change indicator I threw together, as of the time of this capture is seeing it's second largest 1 day move since early Mar.
The VXX is seeing a similar move.


No comments:
Post a Comment