Clearly as we have been expecting, financials have rotated out with Tech taking over leadership today, it was a gut feeling I had and yesterday's Tech charts, NDX and AAPL charts all suggested today would be the day.
On April 10th as the SPX broke the 50 day and as we expected a bounce to form, I said this would be more volatile and thus far it has been, last week we had the biggest 2 day move up all year and the biggest weekly drop all year both in the same week! I am suspecting that the unpredictability factor will be much higher than the least bounces which we have been able to nail nearly perfectly. It is for this reason that I want to start adding some positions short, but YOU MUST have the emotional strength to deal with any potential draw down as the short term signals are showing massive negative divergences/distribution, but we still have some longer charts that haven't gone negative yet, PCLN was a good example. We also have hedge funds now starting to think in terms of self-preservation. We may still yet get that beautiful clear signal, but I would prefer to have some exposure in case this market takes a swan dive, I feel VERY strongly this is the last bounce before that swan dive and all it could take is Spanish Yields pooping above 6% overnight.

XLF/Financials 1 min with a strong 1 min negative divergence, we see the accumulation stage for the bounce and a much stronger negative divergence in place. THEY NEED price strength to sell in to, ths the reason we haven't seen distribution in Tech until today.
The 2 min chart with several accumulation/distribution areas, the last positive divergence wasn't all that big, the negative divergence is fairly big here, at least on par with the last one.
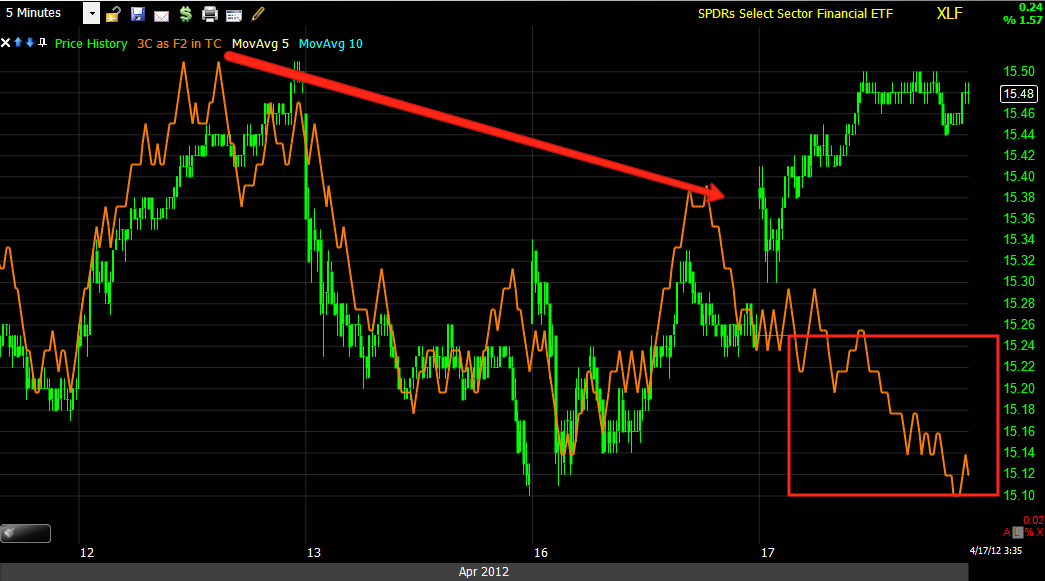
This 5 min chart is more important, look at the selling in to price strength, that's a strong leading negative divergence below the accumulation area, I'd say they have moved all accumulated shares and have likely initiated shorts, but as I often remind you, they need to phase in to the trade as to not disrupt the supply/demand flow and send prices against their positions.
Here we have almost a relative negative divergence, there certainly isn't more strength here, but once again, it is these 15 min charts that haven't broken down quite yet that leave the door open for some further gains.
Here is a leveraged Inverse (Short) Financial ETF, FAZ. The 1 min accumulation today is clear, look at the nice flat quiet area that they almost always accumulate in to.
The 2 min is leading positive.
The 5 min has a huge leading positive divergence and it looks almost as if FAZ has been accumulated as a small double base with the divergence MUCH stronger on the second run to the support area. They have a target accumulation price in mind and FAZ looks like it is in the area. As always, watch for the head fake move just like we saw in AAPL on the open today.
I'm not going to go in to the conversation on how wedges behave as it has been covered many times, but this is the typical set up in a bullish descending wedge and there's a 1 day leading positive divergence. I would start to look at FAZ, I almost prefer ETFs for the initial move (break) until sector rotation and stock performance inside those sectors becomes clear and then I prefer to replace the ETFs with straight equity shorts.
As with all of the trades, if you enter FAZ, you must be willing to have a wider stop as these 15 min charts still haven't convincingly broken yet.


No comments:
Post a Comment