With my options trades I always go out much further with the expiration than I expect the trade to last and July is my preferred expiration, I closed the June Calls (held the July) so I could hopefully rollover the equivalent of what I closed in June Calls. I explained in the last post my reasoning and thought process there.

On the daily chart at the white arrow, this is the high volume and bullish (or bearish in a trend that is up) candle reversal that we see so often and on every timeframe. For a reversal to the upside it's like mini-capitulation, for a reversal to the downside, it's like mini-churning and this seems to work well on any timeframe. The Green arrow shows AAPL crossing above the major support/resistance level that is being watched, it caused some short covering as shorts would be expecting a failed test of that level, you can see that in volume for the day. The next level that will really get shorts thinking is right at the red trendline, I think we'll need some dollar weakness first though before that can become a real full on short squeeze. Right now a lot depends on dollar weakness which depends on Euro strength. The mid term strategic trends in both suggest it will happen, how amidst all the bad EU press, I have no idea, but I lean toward some favorable remarks toward ECB easing or some CB easing.

AAPL today formed a nice little bull pennant, volume was up on the move higher, volume is declining in the triangle/pennant, most traders will look at this and expect a breakout move to the upside, I'm hoping for a little pullback first to add July Calls in to price softness to replace the June position just closed.
On a 60 min chart, the major trendline is to the left, the next area that would really get shorts worried is where we are currently. AAPL backing off that trendline would embolden AAPL shorts which isn't a bad thing, especially when it needs some extra momentum to push it above the next resistance level, their covering (as they tend to place stops at EXACT price/resistance levels) would give that extra upside kick.
Again two strategic views, the long term 60 min chart leading negative, which is why I'm holding equity AAPL shorts and will add to them on price strength/3C weakness and the more immediate intermediate trend which shows a positive divergence at the white arrow on a 60 min chart-this is no small matter on a 60 min chart.
The inline status of AAPL we saw earlier on intraday charts is backing off, remember traders will be expecting a bull flag/pennant to break to the upside, whenever a move like that fails, they are taught to take the opposite side of the trade (go short).
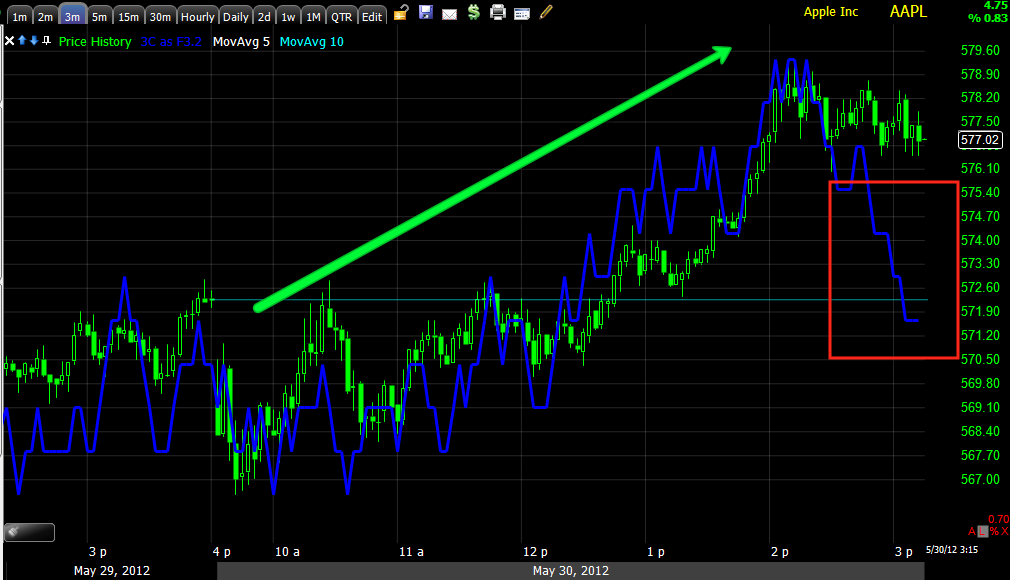
The 3 min that was in confirmation, now seeing a small leading negative divergence.
Overall the 5 min chart is what made me feel a pullback (along with AAPL's parabolic like momentum today) is likely and why I closed the June Calls as they are more susceptible to losses at this point with time decay a factor. Either the 5 min 3C chart will move up, or AAPL will pullback a bit and accumulate and get ready to break that next level of resistance.
For tactical planning, I'm hoping for a bit of a pullback, 3C to gain momentum in to tht pullback, add the July Calls and get ready for the move through resistance which should get stronger short covering moving.


 | Theme by Thur
No comments:
Post a Comment