You may recall one of my core short positions that I have kept in place is BIDU, which is also my best performing straight short (no leverage such as options) at a gain of +21.6%
BIDU daily chart is at a support level and like many other averages, stocks and industry groups, we see that same Harami reversal pattern, except in BIDU's case the candlestick formation is much more appropriate.

5 min chart shows a bear pennant, similar to a bear flag except a flag is a parallelogram price formation that consolidates away from the preceding trend (meaning consolidates slanting upward), but the price formations's implication in Technical Analysis terms is the same, it is a consolidation/continuation pattern with technical traders expecting the pennant to break to the downside and start a new leg down. I don't need to say it, but these obvious price patterns are often manipulated as Wall St. takes advantage of the predictability of technical traders. Volume is correct for the price pattern as well. There's always the chance (even with BIDU moving up as I suspect) that we will see a downside break which sets up a bear trap. Recently with these price patterns the chances have been about 50/50 that there's a downside break first and then an upside breakout creating the bear trap. I'd estimate 10% of the time we see a Crazy Ivan which is a shakeout in both direction before the real move establishes itself.

1 min 3C showing some curious activity yesterday and leading positive in to the bear pennant today.
The 2 min chart NEVER confirmed the recent downside move and stayed in leading positive position.
The 5 min chart shows that same curious activity yesterday in a flat trading range and has added to the divergence today in the pennant.
The 15 min chart is leading positive today, because of the longer history on this chart, the extent of today's leading positive divergence on a 15 min chart doesn't look as impressive as it actually is.
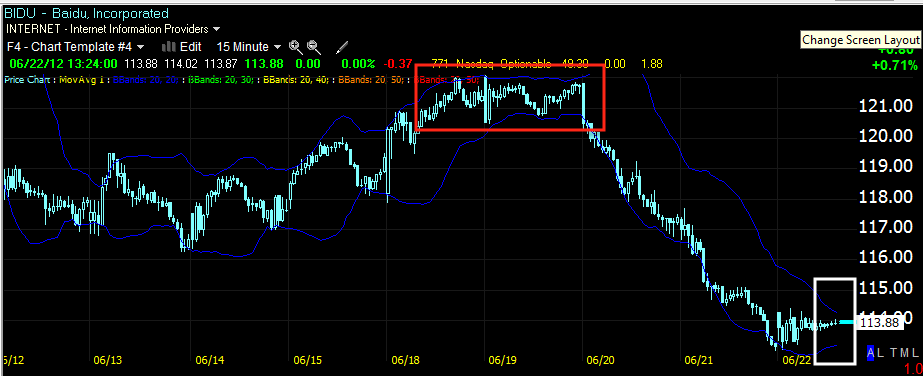
The Daily Trend Channel since we shorted BIDU on an upside bull trap breakout in the red box, since then the Trend Channel has shown 3 breaks of the downtrend, this indicates a change in character.
I haven't pulled this indicator out in a while, this is the Demark inspired custom indicator I developed with long/short signals on a daily chart.
The 15 min Bollinger Bands are also showing a recent change in character as they pinch which nearly always leads to a highly directional move. If e look at price alone and look at BIDU from a traditional Technical Analysis view, this would suggest a short opportunity, however we see these trades manipulated so often and there seems to be good evidence for a move higher in BIDU.


 | Theme by Thur
No comments:
Post a Comment