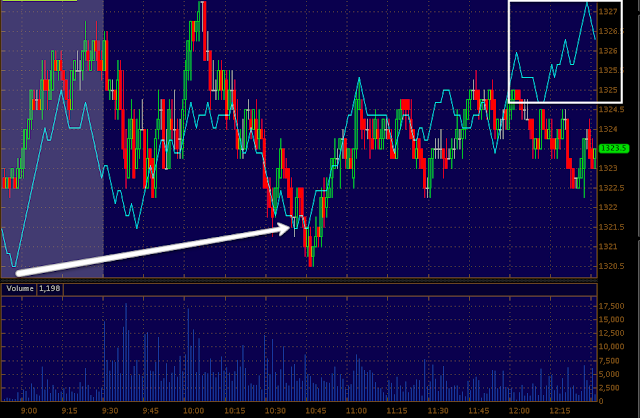
Things could be getting interesting. Earlier today you saw the IWM/Russell 2k improving dramatically, it is generally the leader of a rally or risk on move. Since then there has been additional strengthening across the averages and some industry groups.
I keep coming back to the Goldman Short call, this would obviously create a lot of cheap supply if they wanted to accumulate and generally speaking, if you do the opposite of whatever Goldman says, you tend to come out on top as we have seen with the last 2/2 GS calls.
The thing that bothered me was the mount of damage done to the 15 min charts yesterday, but there's a very real chance that institutional money was behind that to keep the pressure on the market yesterday. As you probably know, we look for positive divergences/accumulation in to a pullback to tell us when a pullback may be ending and give us excellent entries at low prices before the move starts, while most technical traders only chase the move once it starts as they rely on price and price derived indicators.
In my view 1 of 2 things is happening right now, we are seeing improvement for a counter trend (the trend from yesterday being down) bounce as the 15 min charts did sustain enough damage to make a fair assumption that we have more downside to go or 2) the 15 min charts sustained that damage as Wall Street kept the pressure on the markets yesterday to create a very ugly day. Remember, almost all technical traders rely on price and price derived indicators for their analysis, so yesterday would have caused them to come up with a vey bearish view. Continuing with my thoughts on option #2, this could be the accumulation we look for that signifies the end of the corrective move down (in this case on F_O_M_C disappointment and horrible manufacturing readings all in one day and across the globe.
It is worth mentioning that I was very interested in how the risk asset indicators would hold up in to yesterday's decline, they held up very well, especially credit.
The price pattern right now is correct for 3C accumulation.
There is an intraday triangle, for all intents and purposes this is the same as the flat trading range we often see institutions active in underlying trade. Keep in mind as well that the more obvious this triangle becomes, the higher the probability of some sort a head fake move. A head fake move to the downside with increased 3C positive divergences would be bullish and perhaps an excellent entry point.
The daily chart shows a nearly perfect Harami reversal (the Japanese call a Harami pattern, "Mother with baby" referring to the two candlesticks, the first large and the second small and inside the first) in the west we call this an inside day and it has the same implications, the only problem is there isn't a sufficiently long enough preceding downtrend to make this candlestick pattern high probability, but we may need to excuse that based on F_O_M_C manipulation activity.
The averages...
The DIA 1 min wasn't interesting at all earlier today, now it's starting to lead positive during a flat price range.
DIA 5 min was interesting, it has added to the leading positive divergence seen earlier today.
ES, there was nothing special about ES this morning, but now we see some leading positive 3C activity, since the capture ES/3C has made a new high.
The IWM was interesting this morning, the 1 min chart not only was positive yesterday, but has responded with a move of +.70% today thus far.
The 2 min chart has continued to add to the leading positive even with the IWM moving higher, this is rare to see a positive divergence in to higher prices, it would be akin to accumulating on higher prices and we don't see this often, unless there's something brewing in which smart money is willing to accumulate even in to higher prices.
The 3 min has added to the leading positive at a new local high, on an intraday basis there's a slight negative, which may reflect a pullback or consolidation intraday.
The IWM 15 min DID NOT see as much damage as other averages yesterday and as such is starting to lead positive, this is a fairly strong divergence for a single day this early on this timeframe.
QQQ 5 min leading positive, earlier this chart wasn't that interesting, but as it makes new local highs in 3C, it is becoming more interesting rapidly.
SPY 3 min which is adding to a leading positive divergence
Financials, Tech and Energy- "The 3 Pillars" or the 3 industry groups that are essential for a risk on trade.
XLE/Energy 2 min is leading positive
XLE 3 min leading positive to new local highs.
XLE 5 min leading positive to new local highs.
Financials, 2 min leading positive to new local highs.
The Financials 5 min is shaping up.
Tech 5 min is also starting to shape up.
Is interest rates about to start going up?
-
Yes, I know - it does not make any sense - FED is about to cut
rates...but....real world interest rates are not always what FED wants it
to be.
6 years ago


No comments:
Post a Comment