First, more evidence of what appears to be (makes perfect sense) an attempt to lower risk in front of the Greek elections. One way is to sell long positions or risk on positions, another way is hedging the long risk, we may be seeing this (it's too early to tell) as an alternative to out-right selling of risk in an attempt to keep the SPY pin (between $133-$134) as outright selling may lower prices which may mess up the options expiration max pain pin-but that's just a guess; it also could be a bit of both.
Above is the SPY (green) vs TLT , the long term treasury ETF (white). As you can see treasuries historically are a risk off trade or a flight to safety.
Interestingly this morning as the SPY inched higher in a triangle consolidation (more on that next chart), TLT moved up with the SPY which is against its normal inverse correlation demonstrated on th chart above. This would suggest there is a flight to safety, but as both were moving in the same direction (up) earlier, it looks more like a hedge. This could be a simple hedge in front of the Greek elections or it could be as to not effect the options expiration pin (the $133 to just below $134 is a best guess obviously based on yesterday's closing open interest in the SPY).

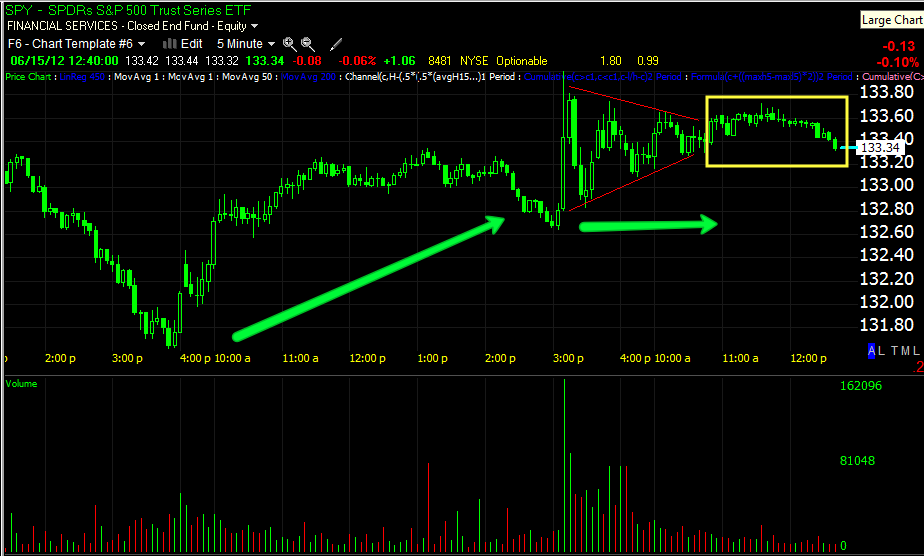
As for the triangle that developed this morning, technical analysis would read this symmetrical triangle which on its own has no inherent bias, as a consolidation/continuation pattern as the triangle's bias is determined by the preceding trend which was up. In typical Wall Street abuse of technical traders (it is technical trader's fault for doing the same thing they've done for 100 years-Wall Street just takes advantage of their predictability), the triangle which would be expected by traders to break to the upside, is seeing a move to the downside. Watch the $133 level, it seems to be the level where an op-ex pin would be most likely. That being said, there isn't the same open interest that we saw last month so there's not as much profit in a pin and if the perceived down-side risks are greater than the profit potential of the pin, we certainly could see the market leak off in more volatile fashion.

The SPY 1 min chart negative on the open, but leading negative in the triangle and price has already responded.
The 2 min chart confirming the 1 min.
The downside 3C momentum starts to fade at the 3 min chart.
The 5 min chart is in line with price, no negative divergence, so it appears that as of now, the negative divergence isn't that strong, it may change, but for now my take is that there's some adjusting of risk, but overall it doesn't appear to be an important inflection point in the market.
The hourly chart a shown yesterday has been leading positive since this consolidation (which is probably largely driven by the Greek elections). As I mentioned yesterday, this 60 min positive is now starting to move the 1 day chart.
The 1 day chart showing tops in the SPY and confirmation of the downside, remember we expected/expect a short squeeze bounce, but the primary trend or larger picture is very bearish. I would not call this a significant positive divergence, I wouldn't even really call it a positive divergence, but the fact the 60 min is strong enough to bleed through and effect the 1 day chart is worth noting.
More updates coming...


 | Theme by Thur
No comments:
Post a Comment