These shorter term 3C timeframe divergences can mean a consolidation which is a correction through time or a pullback which is a correction through price. Lately the market has found more utility in price movement, my sentiment report yesterday had the Twitter Stream traders actually cursing the market, both longs and shorts as it chops about and these traders are finding their conventional technical indicators useless. I'd guess most are trading based on pure emotion and opinion and as usual, chasing the market at the worst possible time to chase a market.
ES 1 min has a large relative/leading positive divergence compared to the negative intraday so again, given what we see on 1-5 min charts for the last week or so, I doubt very much this is a pullback of any meaning, just noise for us and headaches for retail.
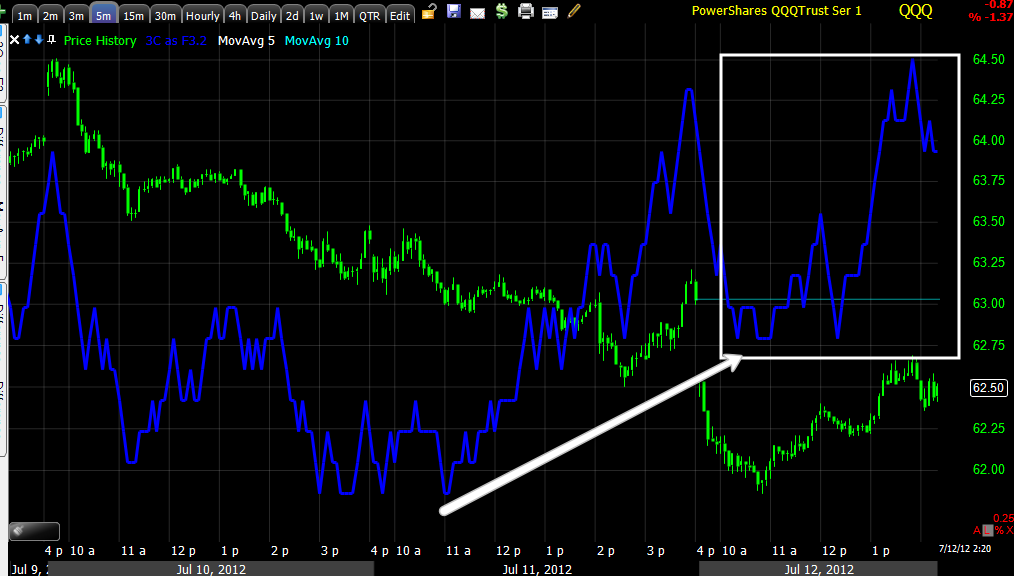
I like the IWM/QQQ version of 3C for stuff like this as it responds faster than the other versions (which is simply a function of different asset classes trading differently, but also makes some sense as the yellow version tends to be a bit slower and also tends to be applied to more NYSE stocks while the faster blue version is applied to the NASDAQ network stocks as a general rule-obviously the call out NYSE method is no where nearly as fast as trade on the computer network of the NASDAQ).
The IWM 1 min shows a slight negative divergence.
The 5 min is leading positive, this is like rock, paper, scissors with the 1 min being paper and the 5 min being scissors.
QQQ 1 min with a lading negative intraday divergence
The 5 min lading positive to a new high.
One other thing to mention, accumulation generally comes in an environment of declining prices and flat trade ranges, why would smart money want to buy in to strength? So these dips intraday are also most likely utilitarian.
SPY 1 min
No sign of anything negative on the 3 min.
So this doesn't look to be an important divergence, just a nuisance.


No comments:
Post a Comment