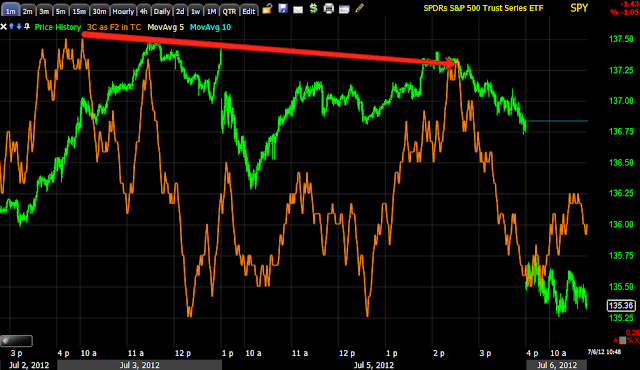
Here's a look at the SPY charts...
SPY 1 min is pretty much in line, there's a bit of an intraday positive although nothing too impressive. We may see some backing in to the gap, but I seriously doubt it will be closed; I think more likely we are seeing a consolidation here before we see another leg down.

The 2 min leading negative position suggests there's plenty more room on the downside, maybe this will help the risk assets like yields and the Euro re-couple.
The 3 min chart leading negative as well, so we have good migration through the timeframes and thus good confirmation so far.
The 5 min leading negative divergence, this is also migration from the shorter charts and also suggests we have plenty of downside before we hit a reversal, likely more downside before we'd even see positive divergences or accumulation in to price weakness.
The fact we hit a 15 min chart with a leading negative divergence I think underscores a few things that created a true overbought condition in the market; the short squeezes didn't help as they sent the market above where it would have been otherwise and part two is actually seen in part 1, the breakdown of correlations like yields and the Euro. Had we not been in short squeeze territory I think the pullback would have already been underway days ago and it would be less extreme. At this point the market has some catching up to do on the downside to those correlations.
Finally a 30 min relative negative divergence, again, suggesting this will be more extreme than what most of us would call a "pullback".


No comments:
Post a Comment