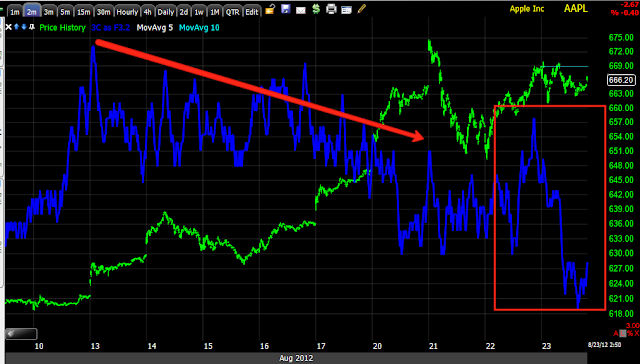
I still want to see how the signals progress in to price strength and make sure we get some, I also want to check the Risk Asset Layout, but from looking at the volatility ETFs, VXX and UVXY as well as TLT / Treasuries, the flight to safety trade, things are starting to make more sense. There are very short term negative divergences there that fit with the short term positives in the market, at 5 mins, where it really counts, its a brick wall, that tells me the probabilities are VERY high that it is not only safe to short in to strength, but it may be the last chance we get.
That being the case, I think AAPL breaks out of the intraday triangle, it is also a perfect head fake set up on a intraday timeframe, after all a reversal has to start somewhere and AAPL is already in a head fake area on a daily timeframe. I told you Wall Street isn't going to make this easy, but you catch the right day like we did with BIDU, it is very profitable, otherwise they are going to want to keep everyone guessing as they slow boil the frog if you are familiar with that phrase.
A symmetrical triangle carries no directional bias with it, it ll depends on the preceding trend which in this case was clearly up, that makes the triangle a bullish consolidation continuation pattern, technical traders expect it to follow the green arrows, this is where Wall Street will game them. Most probably an upside breakout because that is most advantageous to Wall Street to sell/short strength and lock in more longs, but thy could surprise with a downside move instead or even a Crazy Ivan shakeout (both ways). I'd look for the upside breakout though. THIS IS WAY TOO OBVIOUS NOT TO PLAY.
I didn't include the 60 min because I wasn't going to make this a long post, but the 60 min is negative, the 30 min above is clearly negative in a relative and leading way.
The 30 min close up at the triangle area, bulls WILL buy the bullish triangle, but more will buy confirmation of the breakout, it appears those who were willing to buy the triangle saw their shares come from distributed or shares sold short from money smarter than they.
The 5 min chart is very clearly leading negative here.
The trend of th 5 min chart is interesting too, right before a breakout above resistance, there's a quick accumulation zone (power up for the breakout) and then the move which is trending down through th entire thing. There are a LOT of hedge funds with large positions in AAPL, it is not n easy stock to distribute without driving price down, so what is needed is demand and higher prices, that comes with things like a breakout to a new high.
This didn't come out in order, but the 10 min chart i also leading negative at the triangle like the 30 min chart. If the 30 min chart is negative at a triangle this small, it would suggest there's a lot of institutional activity.
Finally the 2 min, leading negative at the triangle.
I probably don't have room for more positions in AAPL, but I think I'll look at taking one any way when I feel the time is as good as it gets.


No comments:
Post a Comment