A mentioned, only the options positions are closed in BIDU for some nice profits, the core short in the equity model portfolio is open and will remain so as it was shorted in the $150 area and recently added to. I don't mind sitting out corrections in the core positions, but with options, I have little tolerance for corrections as we can close the position and re-open it when the correction is done and make more money as the time decay makes the current position worth less. I ALWAYS want to spend the least amount of time possible in leveraged (especially options) positions. The equity BIDU short is doing great.
Here's what I see both big picture and near term... This tells me something about the market too.
First of all, these textbook Technical traders keep doing the same silly stuff over and over again, note the obvious support levels, they put their stops right at support and place the orders with their brokers, so not that we couldn't guess where the stops were, but we don't even need to, we and especially Wall Street can see how many are piled up at those exact levels, think volume rebates! Every obvious sop is hit and short sellers place their orders there too, chasing the trade instead of letting it come to you.
Now that volume rebate money has been made, the Market Maker is probably stuck with some BIDU inventory they'd like to offload, remember if there' no match for your order at market (it happens in a fast moving market), by law the Market Marker (because this is NASDAQ) or the Specialist on NYSE are OBLIGATED BY LAW to provide a bid/ask as long as it's at market. So the Market Maker was able to accumulate or forced to accumulate a lot of BIDU in a stock that is a sining ship, they probably want to off load that inventory so they'll need to create some upside excitement to do that or DEMAND.
Bigger Picture BIDU's 15 min chart, a key timeframe just went leading negative as soon as BIDU entered the flat trading range (easy to fill institutional orders at the VWAP in a flat range) and especially at the had fake high which was a break above local resistance that trader would have bought allowing smart money to sell in to demand and better prices.
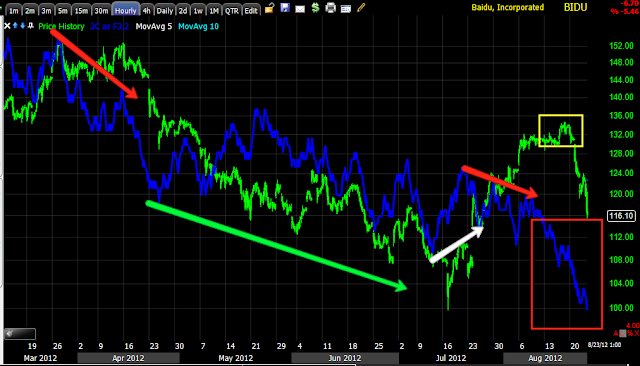
Even bigger picture, the first negative divergence to the left is where we first entered the BIDU core shorts on price strength and a head fake bull trap breakout, this 60 min (very important timeframe) was in line with the downtrend until another head fake bear trap was set at the lows, we entered BIDU long there with options as we were looking for a counter trend rally and we got it, BIDU retraced 50%, then another negative divergence in to the recent top, look at the leading negative move in 3C as the head-fake breakout in yellow occurred, remember what we say, "From failed moves come fast moves" and that failed breakout produced a fast move to the downside, we have members up 250% in Puts!!! I was only up 102% in 3 days, I think I have somethings to learn.
Now the short term trend... Because Nothing goes straight up or down.
The 2 min intraday chart, not an influential big picture timeframe, but excellent for near term moves, this is leading positive in to the selling.
The 3 min negative at the head fake breakout, but leading positive as the stops are hit.
Finally the 15 min, negative at the head fake breakout and a slight relative positive, I question if this is a real divergence or the 15 min just hasn't caught up with fast moving price, there's no turn up so I'm going to say we do NOT have a positive 15 min, but still, this could be a pretty decent move up. We could play it long, but I want to trade on the side of probabilities which means I'll wait for the negative divergences to appear after move up and then enter new put positions. For anyone wanting some BIDU, this may be your chance, just be patient.


No comments:
Post a Comment