I was asked by a member about USO just a little bit ago, as yo might remember I have an open Put position in USO as well as a full-size equity short position.
This was my initial response to the move in USO today:
" I wouldn't be surprised to see a little upside relief as the move down was very parabolic, but the timefrmes are all pretty negative so I think this is a good start to some decent downside, I'd be careful not to get shaken out on any corrective moves."
Here are the charts, to me this looks like a pivotal moment for USO, it also looks like a decent area to consider adding or initiating a short position in USO, the equity short in the model portfolio is only down about 2% from here. We'll look at the full picture here.
The daily chart with a bearish triangle that traders expected to follow the red arrows, instead it created a head fake bear trap and moved higher. There's an area of local resistance and an area a little higher of long term resistance, USO is above both here.
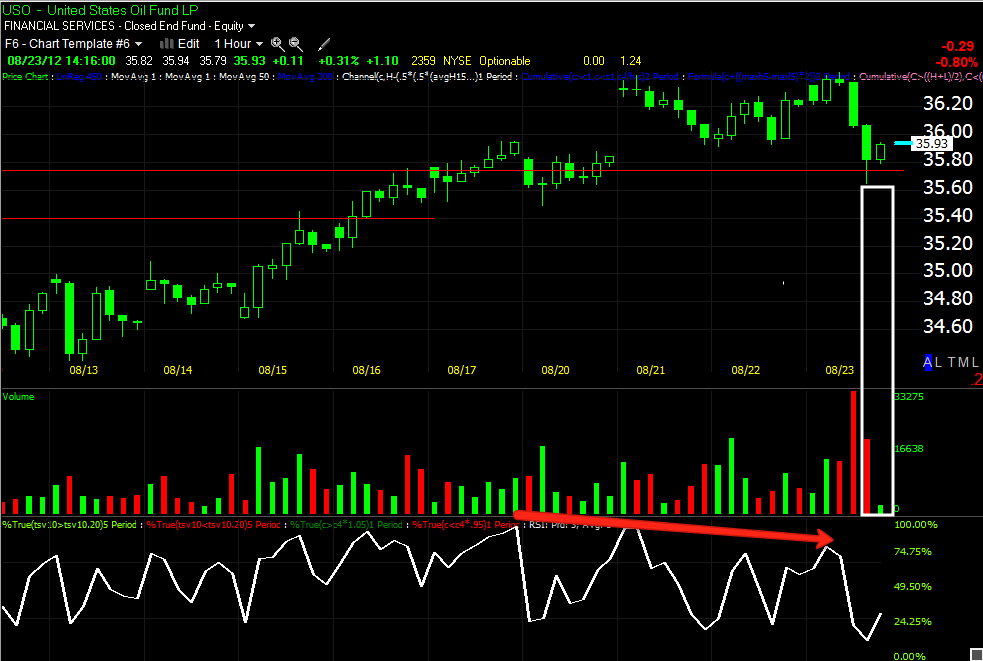
This is the move down today, a little too parabolic so it's not surprising to see that it bounced off a relative divergence.
Here are the areas of support, that's a Wilder's RSI at the bottom
Here you get a better feel for the parabolic nature of the move, I never trust these up or down and right below support it bounced intraday.
This is the long term simple picture, negative at the top with a move above resistance that saw distribution, the head fake move at the bottom that was accumulated as the shorts entered, and a negative divergence here. The divergences aren't sharp because this is a 4 hour chart, it shows the broad strokes.
An hourly chart has more detail, you can see the accumulation of the head fake move down, shorts provided the supply to accumulate, a break above resistance and longs provide the demand to distribute in to.
The 30 min chart's divergences are much more sharp, you can see leading negative as resistance levels were crossed.
The 15 min chart even sharper, again, leading negative, this is part of the reason I opened a full size equity short position in the equities model portfolio.
Remember the market wide accumulation on Aug 2nd, here it is again, the 5 min chart gave a pretty good timing signal as USO gapped up above the resistance levels.
Here's the 2 min chart again a good timing signal as that gap up was sold in to and created a leading negative divergence. I'm set for USO, although I might consider adding a Put if we get some price strength with continued neg. divergences, but if you like the idea, it's still in a very good position with high probabilities and low risk.


No comments:
Post a Comment