Since the Q's looked so bad and since AAPL is a huge part of the NDX, I decided to take a closer look at AAPL today.
Here are the updated charts for AAPL...
AAPL's bull flag, this is an important price formation on AAPL's chart, a break above the flag (According to Technical Analysis) should send AAPL up on its next leg higher which according to the measuring implications of the flag, would be around the $672 area, AAPL has barely budged and volume has faded, this is often the kind of scenario that is part of a bull trap/reversal as buyers coming in on confirmation of the break above the bull flag provide the demand that smart money can sell in to or short in to.
This is the price action since the break above the flag, because it is so choppy it makes intraday charts a bit difficult, but it's also the flat range that distribution is often seen at. There's also relative underperformance in AAPL over the last week.
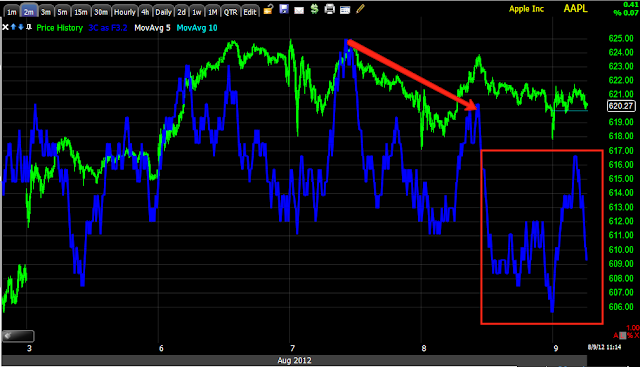
The 1 min chart this morning does show a leading negative divergence similar to the Q's, at least in classification.
The longer the chart, the less detail, but the more trend that is uncovered and the more important the signals. The 2 min chart also shows a leading negative divergence, similar to the QQQ.
At 5 mins, it looks very clear that there has been distribution in the AAPL range above the bull flag as this chart is sharply leading lower/negative.
The more important charts as far as institutional activity are the 15, 30 and 60 min in that order, the 30 min above has not only been getting worse (which I would interpret as continued distribution of the original large accumulation of shares back in May, but likely short selling as well-Wall Street firms tend to herd together as to not stand out as an under-performer and lose a very comfy management job). The current position is a deep leading negative divergence as the move above the bull flag took place. As I often say, "When in doubt, go to the longer term charts".
Here we see the same thing on the 60 min chart.
I have no intensions of closing AAPL shorts at this time in any of the model portfolios.
Is interest rates about to start going up?
-
Yes, I know - it does not make any sense - FED is about to cut
rates...but....real world interest rates are not always what FED wants it
to be.
6 years ago


No comments:
Post a Comment