The IOC Sept $95 Puts are at a small profit, the Equities model position is at a loss as a core short position, but I'm sticking with both as I still like IOC as a short idea. As I showed in the Big 3 post from yesterday, Energy looks to be at a turning point, IOC is in the Energy Sector.
Here are the charts, I especially like where IOC is now (thus the reason for opening the recent put).
Like most stocks, IOC has been drafting off the market and its industry group. Most traders go about stock picking the complete opposite way; if you understand that the biggest influence on most stocks on any given day is the market direction itself, then the first thing to look at is the market, not the stock. The second most influential force is the Industry group and finally the stock, this is why most stocks follow the market and why advance/decline lines and other indicators are useful as they show when there's a change in character in this trend. Above is IOC in green and the SPY in red, even the second to last break above resistance at the end of July happened in the SPY and IOC almost the same exact time.
We know the underlying trade in the market and Energy is not good, now IOC...
The first move above resistance saw stronger volume than the last move, today is the first day IOC has traded under what is now support as well.
Here's the 5 min intraday chart with IOC moving below support on a volatile move, after that in the white box a candle with a long upper wick at the day's highs which looks like a distribution candle or "churning", in either case the highs ended there for the day as higher prices were rejected. Right now IOC has found some intraday support at the important support line, a serious break below this line would almost certainly confirm a head fake move and bull trap, a move below the next support level would be an even stronger bull trap.
Only the 1 min chart is positive intraday which is likely support just mentioned.
The 2 min chart is in line with price so the 1 min divergence can't be that strong.
The 3 min chart is in a leading negative divergence right where IOC made the breakout (head fake?) move above resistance, this suggests that there's been underlying selling in to that price strength.
The 5 min chart shows the same implication at the same area.
Here's the 15 min chart close up, lading negative at the breakout area.
Here's the long term 15 min chart, leading negative on a long term basis as well as intraday.
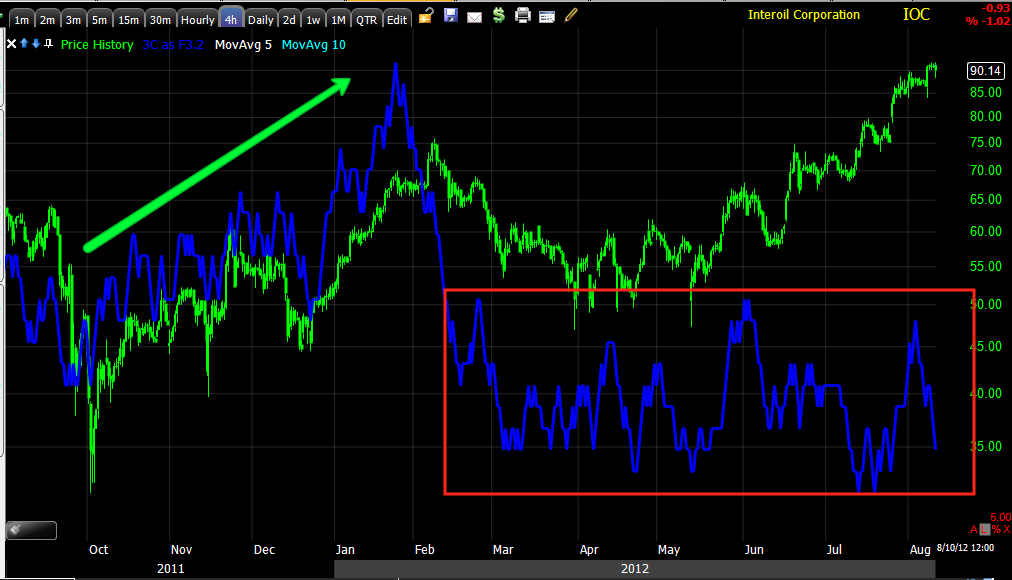
The real monster chart and big picture in IOC is this 4 hour chart which showed perfect confirmation with 3C making higher highs with price at the green arrow, since the last run above that major resistance, the 4 hour has been leading negative with NO confirmation.
I also like IOC here because a stop can be placed just above the recent highs, thus the risk is not very large.
I'll continue to hold both positions (core short and the PUT)


No comments:
Post a Comment