This is the replacement ETF for TYP, the charts here confirm just about everything else we have seen and also hints at timing. For a equity long position I think TECS is in a fine place to go long the ETF, for a Call Position (I haven't checked what kind of open interest TECS have, but I would make sure there's some liquidity), I'd probably wait a day or so for the best entry.
TECS daily.
This is a bullish Ascending Triangle, it's about 2/3rds complete, any breakout of a price pattern lie this around 2/3rds completion is a very strong breakout, rather than waiting until the triangle reaches a full apex. This is an inverse ETF so the price pattern here is highly unlikely to be anything but naturally occurring as it is simply the opposite of what is happening in XLK so head fake moves, etc are highly unlikely unless they were to occur in the underlying issue, XLK. There is a gap just below today's action, from what we have seen in Tech and Tech stocks today, it seems likely that the gap will be at least partially filled, this is where I'd be looking at a possible Call position as timing is more crucial when you are dealing with 10x leverage rather than 3x and you have a built in time decay issue.
The underlying issue, XLK forming (whether intentional or simply organic), a bearish descending triangle right at it's had fake area represented by the long red trendline which is former April highs. As I showed in several issues today, the actual break below or confirmation of a head fake move is very close, it's not as far away as one would think, therefore the downside momentum created by a head fake move, at least in Technology's case, is right below today's close.
TECS 60 min chart, the first run from the April lows was on a fairly strong positive divergence, the current divergence is MUCH stronger.
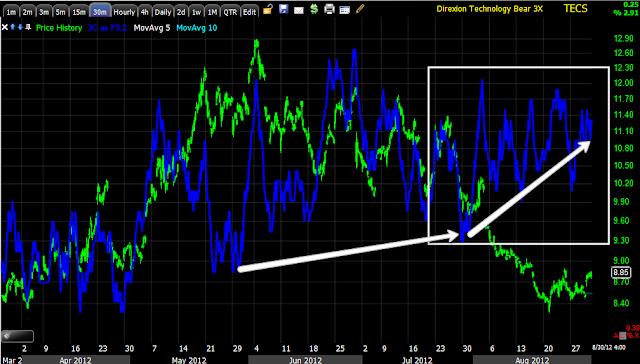
30 min positive divergence in TECS.
15 min positive or rather leading positive like the others.
5 min leading positive.
3 min leading positive, that is a LOT of confirmation. We sometimes have a rare false signal in 1 timeframe, but when we have so many timeframes all looking so similar, it is excellent confirmation.
The 2 min chart shows accumulation and a short term divergence in to today's strength, which confirms the positive divergences in Tech seen today, this also makes the pullback to the gap more likely.
Here's the pullback area, for Calls, anything in or below this area with positive divergences.
Is interest rates about to start going up?
-
Yes, I know - it does not make any sense - FED is about to cut
rates...but....real world interest rates are not always what FED wants it
to be.
6 years ago


No comments:
Post a Comment