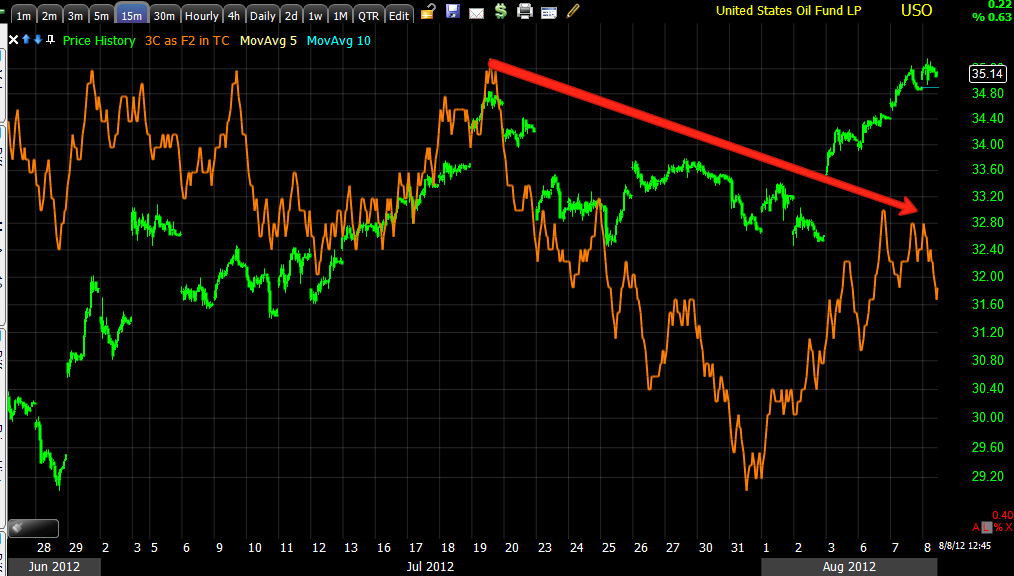
You saw the earlier charts, especially the fact that many or most of the charts are negative in some fashion or another as USO moved above local resistance, lets not forget this move up in USO started with a head fake move/bear trap.
Here's the bear trap/ head fake move on 6/21-6/28 from a bearish descending triangle consolidation that technical traders expected to break to the downside and then resume the downtrend, it broke to the downside, but was accumulated as short sellers stepped in, they gave smart money the shares to accumulate with their short selling. Now it "appears" we are in a similar bull trap/head fake move (yellow).
On a 60 min chart even the bearish consolidation was being accumulated (white arrow), the break below it which many shorts will wait for as confirmation saw an even stronger positive divergence as it went leading positive on the 25-28th (white box). Now it appears that those shares have all been distributed and most likely in to shorting them as the 60 min chart has a nasty negative divergence at the break above resistance.
As shown earlier, the 15 min chart as well as the 30 min chart confirm the same.
On the 5 min, this is why I'm thinking of waiting for better timing before considering an options position as well as perhaps a better entry, we do have a leading negative divergence (red box), but within that an intraday positive relative divergence. The leading divergence (negative) is MUCH stronger than the positive, but it is still a timing issue.
As shown before, as USO broke above resistance, all of the short term charts' trends went leading negative, the most obvious reason I can think of is the breakout would bring in longs on price/breakout confirmation, their buying provides the demand institutional money needs to sell short in to and at better prices. Also note the accumulation on the 2nd, THAT'S LAST THURSDAY, the same day we saw it market wide, the same day GS put out their "FREE" "buy the Euro" trade rec'd, which means GS has Euros and anything that is risk related to sell, that would explain these leading negative divergences.

If you look closely, today there's a triangle-like pattern forming, Bollinger Bands (10-min) show the squeeze, a directional move is highly likely, from our experience reversals-no matter what timeframe, see a head fake move about 80% of the time just before the reversal. That would mean we would have such a move on the daily and tactically if we get an upside breakout from the triangle-like intraday pattern, we'd have it intraday as well.
This is what I'd be looking for to start a Put position in USO and add to the equity short...
(1 min chart of the triangle like pattern), a break to the upside with 3C moving to a new low, that would be pretty good confirmation of a false breakout on an intraday timeframe, good timing, an excellent entry for an options position with little risk and high probabilities.


 | Theme by Thur
No comments:
Post a Comment