

First the Euro...


NASDAQ Futures

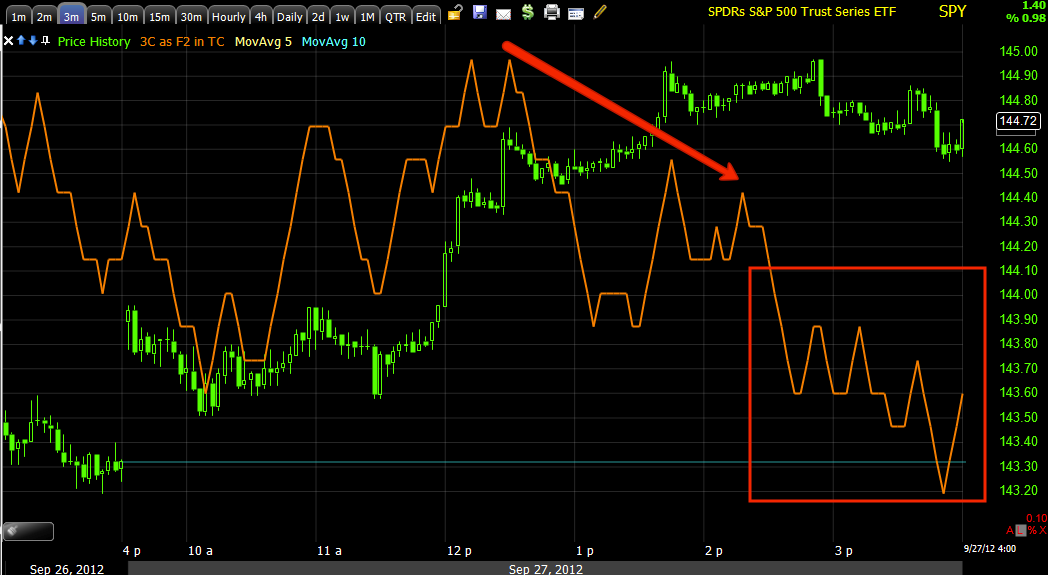
QQQ


ES (S&P E-mini Futures)


The 5 min chart also went slightly negative.
Typically divergences on the averages like QQQ/SPY that we see at the end of the day, tend to play out the next day as if smart money prepared for the next day in advance, futures are a bit different, although the signals on the SPY/QQQ and others often will see confirming overnight activity in the futures.
I would expect to see the SPY, QQQ, etc pullback a bit and repair the damage on the short term charts and keep the 5 min chart healthy enough to continue the bounce/move higher, if that happens and we see some positive activity in to a pullback, then it will likely offer you an opportunity to take on some long positions to play the bounce/upside, however if price keeps moving up without repairing the damage to the short term charts, it's likely the 5 min chart will see more damage and it will continue to migrate to more important charts; in this scenario, the bounce will look strong price wise, but it will essentially be rotting from the inside out and it would not bode well for any kind of sustained move. If this is the scenario, the probabilities would be to short in to price strength/3C weakness for a resumption of the move down. I personally am leaning toward a continued bounce and an opportunity to add some long exposure to take advantage of it as the market is pretty oversold, but we'll have to let the market tell us where the probabilities are.
This is why I wanted to see both downside and upside post QE3 to see how the underlying trade reacts, this will tell us a lot more about what smart money is doing and whether QE was front run by smart money for the first time which would likely mean they'd be looking to sell in to the policy that has all traders conditioned to believe the same thing about QE.
In any case, 1 bridge and opportunity at a time.


No comments:
Post a Comment